Predicting Stress Development and Incomplete Conversion in Thick Thermoset Tooling Runs
Predicting cure exotherms and volumetric shrinkage gradients prevents matrix cracking, low core conversion, and dimensional distortion in thick thermoset tools.


Exotherm
Manufacturing heavy composite tooling from thermoset resins introduces severe thermal dynamics absent in thin structural laminates. Carbon fiber reinforced epoxy or bismaleimide tools over 20 millimeters thick trap the heat generated during crosslinking reactions. Ring-opening and addition polymerizations release substantial enthalpy, typically 350 to 550 Joules per gram of pure resin matrix.
In laminates under five millimeters, conductive loss through aluminum or composite tool plates removes this energy fast enough to hold internal cure temperatures near autoclave air setpoints. Thick sections, however, present high resistance to heat transfer because thermoset polymers have low thermal conductivities, generally 0.15 to 0.25 Watts per meter-Kelvin.
Heat accumulates within thick core sections. When energy from the reaction exceeds what can conduct outward to the tool surfaces, core temperatures climb above ambient conditions. This self-heating loop accelerates reaction kinetics in accordance with Arrhenius behavior, compounding heat release until temperature spikes pass matrix degradation limits.
Autoclave operators monitoring nominal air temperatures of 120 degrees Celsius can easily miss internal core spikes above 210 degrees Celsius, which destroy resin toughness, cause microcracking, and char the matrix.

Thermal Energy Accumulation in Thick Tooling Laminates
Internal heat retention in monolithic tooling blocks depends heavily on laminate thickness, resin volume fraction, and ramp rate. Carbon prepreg systems formulated for high-performance tooling typically contain 35 to 40 percent resin by weight. During initial heating, viscosity drops rapidly, allowing fiber bed compaction and consolidation.
As temperatures reach reaction onset, volumetric heat generation turns the tool core into an internal heating element.
The differential balance governing internal temperature evolution follows Fourier heat conduction combined with chemical heat generation terms:
Density multiplied by specific heat capacity and rate of temperature change equals heat flux divergence plus volumetric heat generation. The volumetric term equals resin density multiplied by total reaction enthalpy and conversion rate. In sections 50 to 100 millimeters thick, heat flux divergence cannot dissipate generated energy quickly enough, causing peak internal temperatures to shift higher and occur earlier relative to boundary surfaces.
A 50-millimeter epoxy tooling prepreg section cured without intermediate dwell exhibits core temperatures exceeding autoclave setpoint by 42 degrees Celsius due to exothermic reaction heat.
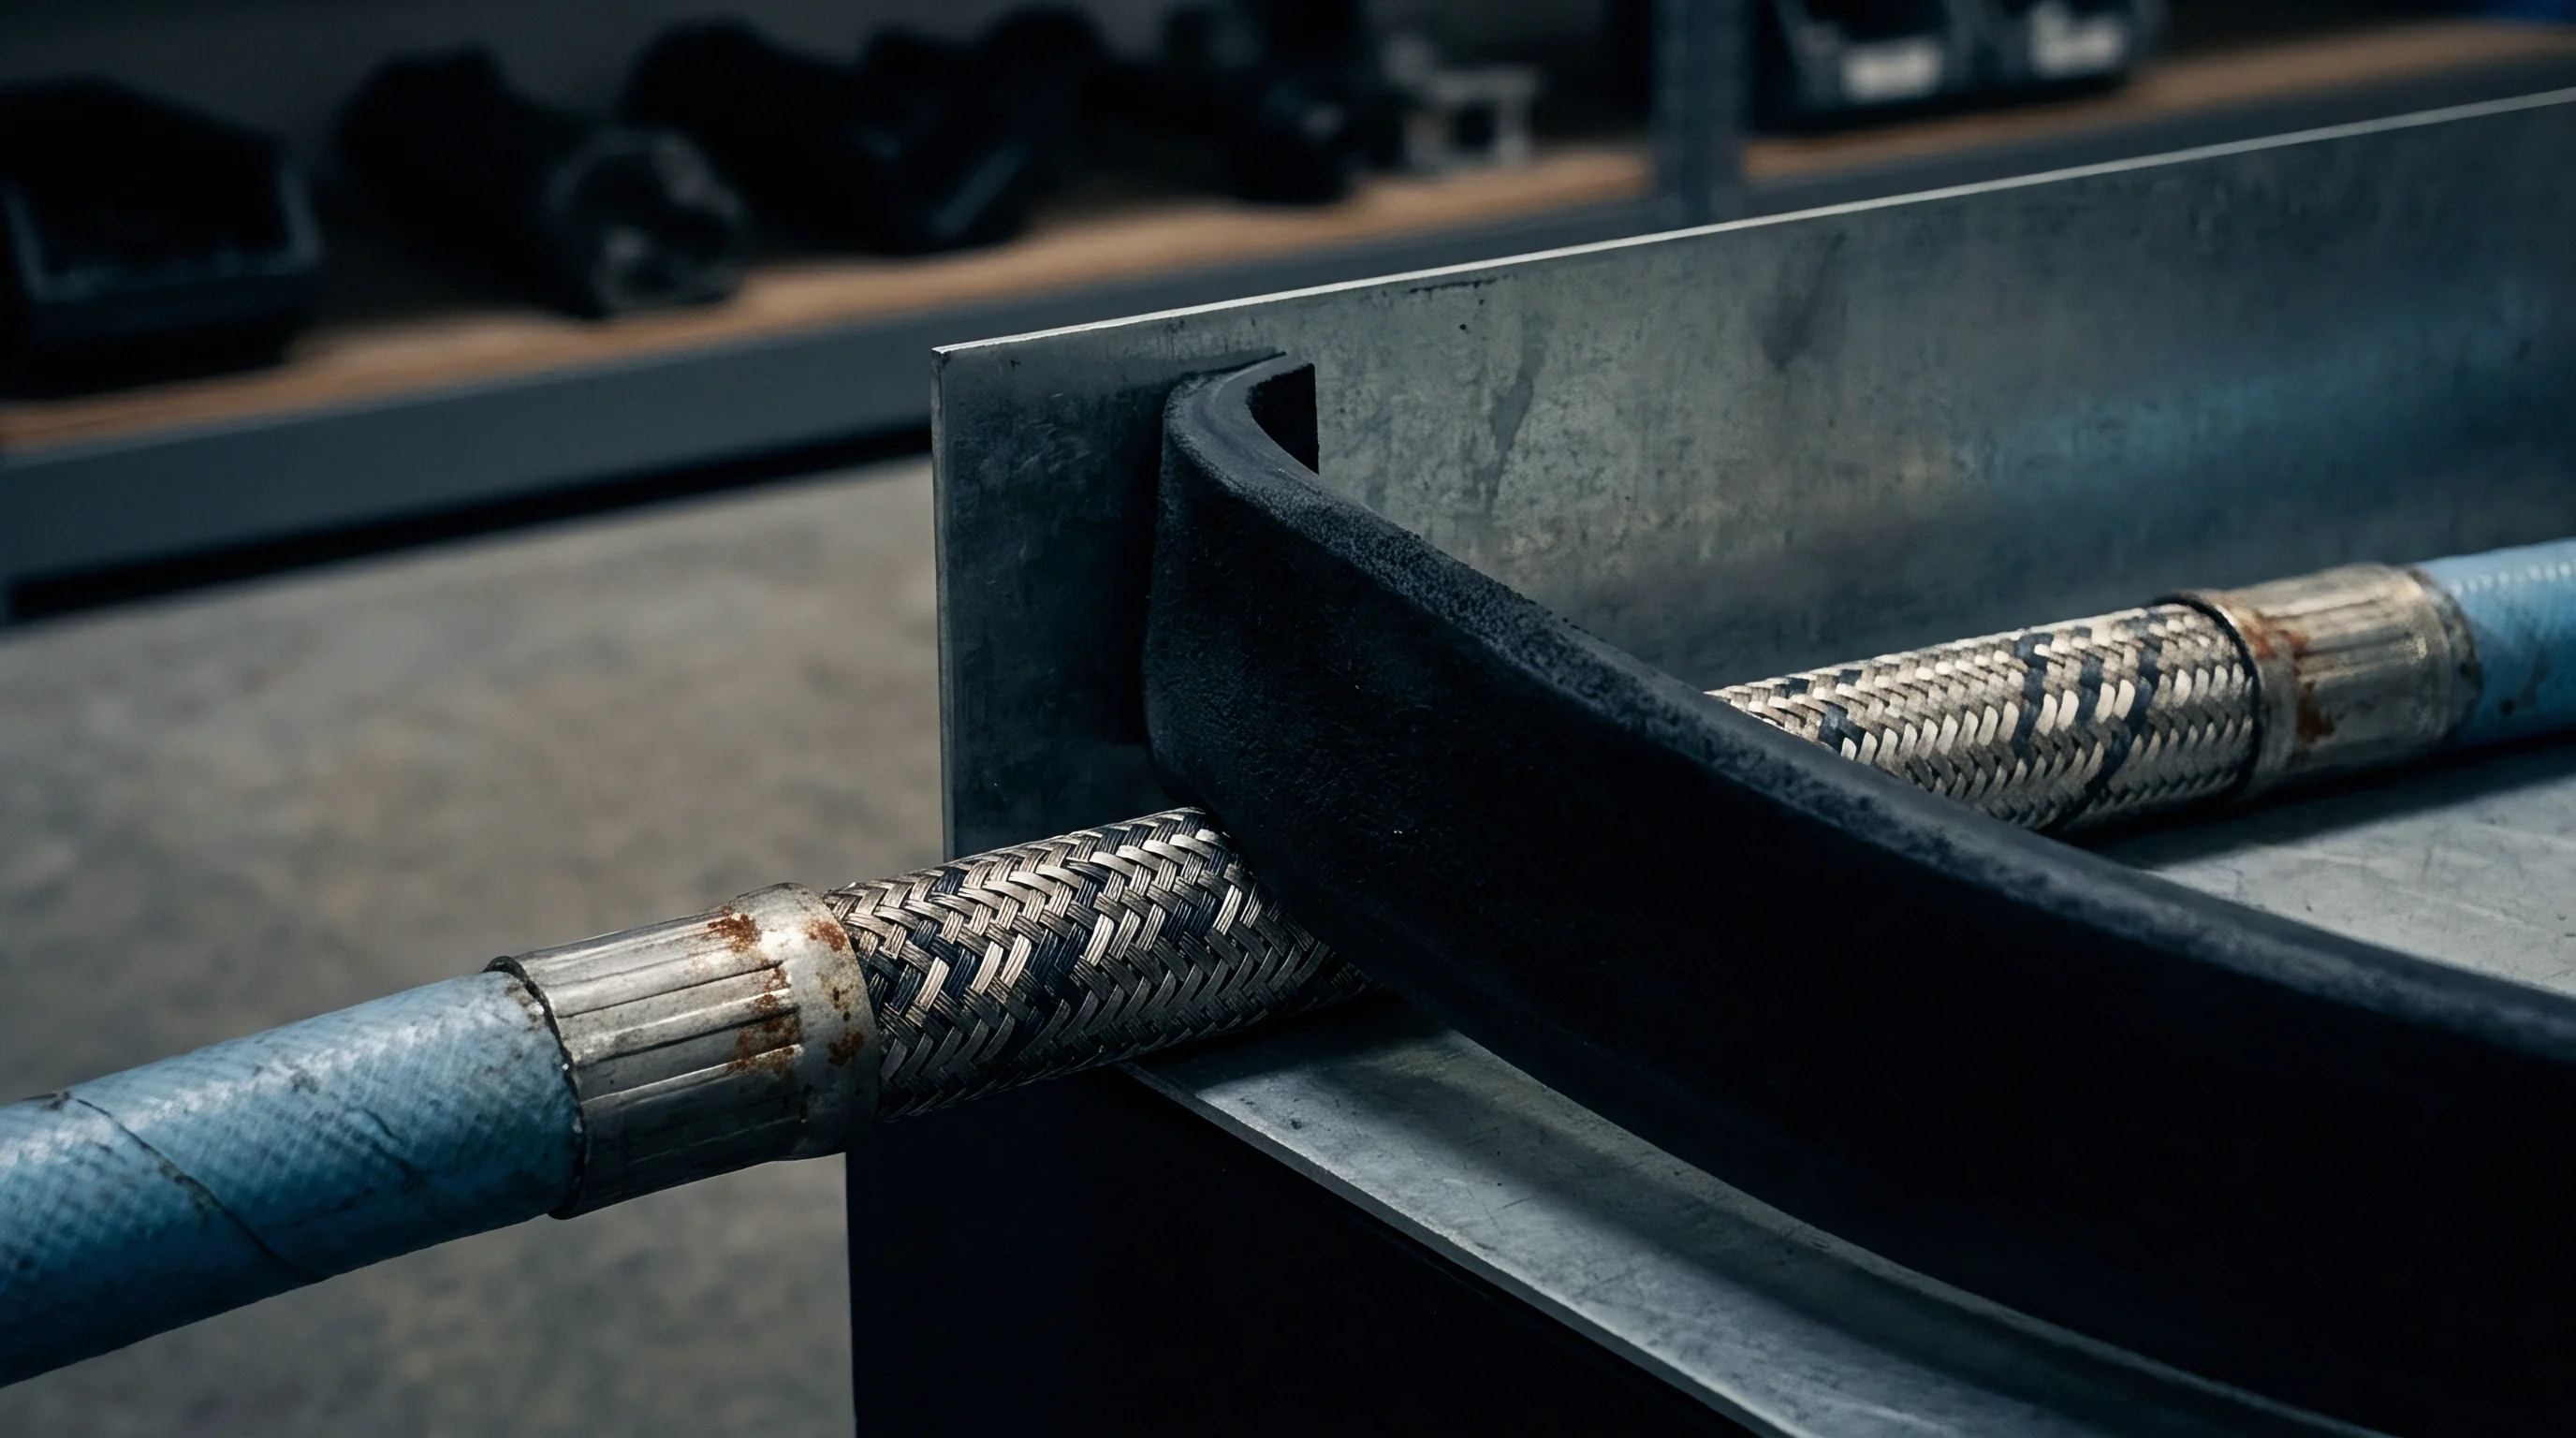
Volumetric Heat Generation and Fourier Conduction Kinetics
Predicting thermal profiles across thick tooling blocks requires accurate characterization of reaction enthalpy and heat transfer properties throughout cure. Specific heat capacity rises with temperature, while thermal conductivity changes as liquid resin transitions into a glassified network. Neglecting these temperature-dependent thermomechanical properties introduces errors exceeding 25 degrees Celsius in peak temperature predictions.
Conduction through carbon fiber reinforcement introduces strong anisotropy. High longitudinal conductivity along carbon fibers helps dissipate heat in planar dimensions, whereas low transverse conductivity across ply thickness impedes heat flow toward outer bag surfaces. Mold geometry, ply orientation, and boundary heat transfer coefficients at mold faces determine whether crosslinking heat escapes or remains trapped inside internal ribs and deep radii.
Uncontrolled thermal spikes lead to core matrix degradation, cracking, and total tool scrap before the first part is even laid up.


Kinetics
Reaction kinetics govern the rate at which resin transforms from monomeric liquid to a crosslinked solid network. Accurate rate models serve as the baseline for predicting both heat release and mechanical property development. Simple order-based reaction models fail to capture thermoset curing behavior because crosslinking involves multiple competing pathways, self-catalytic mechanisms, and phase transitions like gelation and vitrification.
Autocatalytic phenomenological models provide practical rate calculations across wide processing windows. The Kamal-Sourour rate equation models crosslinking by combining non-catalytic and autocatalytic rate constants with reaction order exponents:
Rate of conversion d-alpha over d-t equals the quantity k1 plus k2 times alpha to power m, multiplied by the quantity 1 minus alpha to power n. Here, alpha represents degree of conversion ranging from 0 to 1, while k1 and k2 follow Arrhenius temperature dependencies governed by activation energies and pre-exponential factors. Reaction orders m and n capture matrix-specific catalytic pathways.
Phenomenological Rate Equations and Diffusion Control
Phenomenological models track chemical conversion accurately during initial liquid and rubbery states. As crosslinking progresses, molecular weight increases, restricting polymer chain mobility. When the glass transition temperature approaches the cure processing temperature, matrix vitrification occurs, shifting reaction control from chemical activation energy to molecular diffusion kinetics.
Diffusion control causes reaction rates to decelerate sharply before complete crosslinking occurs. Modeling software accounts for this by modifying rate constants with critical free volume expressions or DiBenedetto-based glass transition relationships. Including these diffusion control functions prevents overestimating final conversion states in low-temperature cure profiles.
Thicker tooling sections demand longer intermediate temperature holds to equalize heat prior to matrix gelation.

Differential Scanning Calorimetry Model Calibration Hazards
Calibrating kinetic models relies on experimental heat flow data collected through Differential Scanning Calorimetry (DSC). Operators run dynamic heating tests at multiple rates alongside isothermal holds to extract total enthalpy, activation energies, and reaction orders. Standard calibration protocols carry significant risk when applied directly to thick tooling simulations.
Dynamic DSC tests performed at high ramp rates suffer from thermal lag inside sample pans, shifting exothermic peaks toward higher temperatures and artificially inflating calculated activation energies. Isothermal DSC measurements often struggle to establish an accurate baseline, undercounting total reaction enthalpy. Model parameters fitted solely to thin crucible samples ignore resin batch variations, volatile evaporation heat, and promoter depletion present in production prepreg rolls.
| Resin Type | Total Reaction Enthalpy (J/g) | Activation Energy E1 (kJ/mol) | Activation Energy E2 (kJ/mol) | Conversion at Gelation (alpha) |
|---|---|---|---|---|
| Standard Tooling Epoxy (120C) | 420 – 460 | 62.5 | 51.2 | 0.58 |
| Toughened BMI Tooling Resin | 320 – 370 | 78.1 | 64.3 | 0.52 |
| High-Temp Cyanate Ester | 480 – 520 | 84.0 | 71.0 | 0.48 |
| Low-Exotherm Tooling Epoxy | 280 – 330 | 58.0 | 47.5 | 0.61 |
| Data derived from differential scanning calorimetry dynamic ramps (0.5 to 10 K/min) and isothermal holds. | ||||
Calibrating kinetic parameters requires multi-rate non-linear regression with numerical optimization algorithms. Parameter sets fitted to a single ramp rate introduce substantial errors when simulating thick tooling cured under slow 0.2 degree Celsius per minute ramps. Model validation requires verifying dynamic conversions against independent isothermal runs across the full thermal window.
Published isothermal rate constants do not apply universally across all laminate thicknesses, as elevated conversion triggers diffusion-controlled reaction slowdown.


Cure
Numerical modeling of thick thermoset tools requires coupling thermal energy transport, chemical kinetics, and mechanical stress development into a unified finite element framework. Decoupling thermal predictions from stress calculations introduces severe errors because temperature distribution governs crosslinking rates, matrix modulus growth, and volumetric contraction. A fully coupled simulation updates material stiffness, CTE, and chemical shrinkage strains at every integration point throughout the cycle.
Calculating phase evolution requires tracking glass transition temperature as a function of conversion. The modified DiBenedetto equation models glass transition shift accurately:
Glass transition temperature T-g equals uncured glass transition T-g-0 plus the product of parameter lambda and conversion alpha, divided by the quantity 1 minus parameter 1 minus lambda times conversion alpha, multiplied by the difference between fully cured glass transition T-g-infinity and uncured T-g-0.

Coupled Thermal Kinetic Mechanical Numerical Simulation Workflow
An accurate process model relies on a sequential three-step numerical calculation loop. First, the heat transfer module solves for nodal temperature distributions, incorporating exothermic heat generation terms from kinetic state variables. Second, the kinetics module updates conversion rates, total degree of conversion, and glass transition state at each time step.
Third, the mechanical viscoelastic module calculates incremental strains, stress buildup, and stress relaxation based on instantaneous material stiffness.
Consider a 60-millimeter thick carbon-epoxy tooling block processed under a direct ramp to 180 degrees Celsius at 2.0 degrees Celsius per minute. The simulation framework calculates an internal core temperature peaking at 228 degrees Celsius due to exothermic heat retention. Core conversion reaches 0.96 within 40 minutes, while tool surface conversion sits at just 0.42.
As the core vitrifies while surface skins remain in a liquid-rubbery state, severe volumetric contraction imbalances develop across the wall thickness.
Glass Transition Evolution and Vitrification Trajectories
Vitrification occurs when the instantaneous glass transition temperature reaches the ambient cure processing temperature. If processing conditions allow vitrification prematurely at low conversion levels (alpha under 0.75), chemical crosslinking virtually ceases. Resin remains trapped in an incomplete conversion state, lowering operational temperature capability and compromising mechanical strength.
Correcting conversion deficits requires elevated post-cure cycles. However, heating vitrified resin above its current glass transition without adequate mechanical support triggers rapid stress release and warpage. Simulation tools must trace vitrification trajectories continuously to ensure processing temperatures stay above instantaneous glass transition values until reaching the target crosslink density.
A multi-stage hold profile that aligns heat input with cure gelation rate prevents internal stress concentration far better than ramping rapidly to peak temperature.

Shrinkage
Dimensional changes during thermoset tool fabrication stem from two distinct physical mechanisms: chemical cure shrinkage and thermal contraction. Liquid resin undergoing crosslinking experiences significant volumetric compaction as covalent bonds replace loose van der Waals spacing. Volumetric cure shrinkage in typical tooling epoxies ranges between 2.5 and 5.0 percent.
When this shrinkage occurs in the liquid state prior to gelation, fluid flow accommodates the volume reduction without generating mechanical stress.
Gelation marks the physical transition where resin transforms from a viscous liquid into a viscoelastic gel network. This gel point represents a critical threshold in residual stress prediction. Any cure shrinkage occurring after gelation induces internal strains within the constrained fiber bed, initiating mechanical stress build.

Volumetric Strain and Viscoelastic Modulus Development
Calculating residual stress requires tracking rubbery-to-vitrified modulus evolution alongside volumetric strain components. Before gelation, shear modulus remains near zero. Beyond gelation, shear and elastic moduli build rapidly with conversion and temperature, reaching gigapascal levels upon vitrification.
| Material Phase | Conversion State (alpha) | Young Modulus E (GPa) | Volumetric Shrinkage strain (%) | CTE (10^-6 / K) |
|---|---|---|---|---|
| Liquid Pre-gel | 0.00 – 0.55 | 0.001 – 0.01 | 2.0 – 3.5 | 120 – 180 |
| Rubbery Post-gel | 0.55 – 0.85 | 0.05 – 0.35 | 0.8 – 1.2 | 60 – 90 |
| Vitrified Solid | 0.85 – 0.98 | 3.2 – 4.5 | 0.1 – 0.3 | 25 – 45 |
Viscoelastic relaxation mitigates stress accumulation while resin remains above its glass transition temperature. Maxwell or Prony series viscoelastic models capture time-dependent strain relief during elevated thermal holds. High process temperatures enhance relaxation rates, reducing locked-in stresses provided thermal gradients across the tool remain small.

Where Does Residual Stress Peak in Carbon Epoxy Tooling?
Internal stress concentrations peak near rigid ply intersections, stiff core webs, and deep corner radii. Shear stresses concentrate intensely along the bondline separating thick tooling skins from lightweight reinforcement substructures. Differential thermal contraction during cooldown from peak cure temperature further amplifies these residual stresses.
Carbon fibers exhibit negative axial thermal expansion coefficients (-0.5 x 10^-6 / K) alongside high positive transverse coefficients (28 x 10^-6 / K), whereas the isotropic epoxy matrix carries high positive CTE values (50-65 x 10^-6 / K). Mismatch between fiber and matrix CTE drives micro-scale interlaminar shear stresses upon cooling.
Compliance with ASTM E2160 residual enthalpy analysis ensures uncured resin fractions remain below two percent before autoclave tooling release.
When internal shear stress exceeds local transverse tensile or interlaminar shear strength, microcracking initiates inside thick ply clusters. These internal cracks propagate during subsequent thermal cycling, causing vacuum loss, structural stiffness loss, and premature tooling failure. Structural core interfaces accumulate severe residual stresses.
Specification requirements following ASTM E2160 mandate full residual enthalpy testing on core coupons to prevent shipping tooling with latent unreacted monomer.

Gradient
Thermal lag across thick tooling sections causes severe curing gradients. Autoclave heat enters the tool block through exposed exterior bag surfaces and conductive metallic support frames. Laminate surfaces heat rapidly, while internal core regions lag behind due to low transverse thermal conductivity.
This creates a spatial conversion gradient where outer skins crosslink and gel long before the internal core reaches reaction onset.
Gelation front propagation governs structural distortion and residual strain locking. When outer surfaces gel first, they construct a rigid shell around a liquid core. As the internal core subsequently crosslinks and undergoes chemical shrinkage, the rigid outer shell resists volumetric strain accommodation.
This constraint generates tensile stresses in the core and compressive stresses along outer skins, producing geometric warpage, corner spring-in, and planar distortion.
Core to Surface Thermal Lag and Gelation Asymmetry
Managing thermal gradients requires structured multi-step thermal profiles rather than single linear temperature ramps. Designing cycle parameters involves executing a precise sequence to equalize temperature fields before crosslinking onset:
- Calculate thermal diffusivity across ply thickness using composite micromechanics equations to establish maximum allowable heating rate thresholds.
- Select an initial thermal dwell temperature 15 to 25 degrees Celsius below resin reaction onset to allow core heat absorption without triggering exothermic release.
- Extend the intermediate dwell duration until surface-to-core thermal differentials drop below 3.0 degrees Celsius across the thickest section.
- Ramp heating at reduced rates (0.1 to 0.5 degrees Celsius per minute) through the resin gelation window to minimize volumetric contraction rates.
- Implement a high-temperature secondary dwell to complete diffusion-controlled crosslinking and elevate final glass transition temperature above operating requirements.

Dwell Temperature Selection Strategy for Thick Tool Wall Laminates
Establishing intermediate dwell temperatures prevents catastrophic thermal runaway inside thick tool walls. For a 40-millimeter epoxy tooling prepreg system with reaction onset at 110 degrees Celsius, setting an intermediate dwell at 90 degrees Celsius allows core temperatures to equilibrate without initiating rapid crosslinking. Holding at this plateau equalizes matrix viscosity across all plies, enabling uniform compaction and volatile evacuation.
Lowering secondary ramp rates preserves temperature uniformity as crosslinking accelerates. Thermal gradients across laminate thickness remain under 5 degrees Celsius throughout gelation, preventing asymmetric skin locking and minimizing springback distortion on complex curved master models.
Whether real-time dielectric sensing can reliably distinguish viscosity collapse from gelation across varying carbon fiber volume fractions remains a disputed topic on the shop floor.

Validation
Verifying conversion completeness and stress state integrity inside heavy composite tooling requires robust diagnostic techniques. Surface inspection tools such as standard Shore hardness or surface FTIR spectroscopy fail to detect internal conversion deficits or core microcracking. Core regions suffer the highest exothermic spikes and thermal lag, making them the primary zone for material degradation and incomplete curing.
Destructive coupon testing on extended tool flash or co-cured core blocks provides definitive material state data. Differential Scanning Calorimetry measures residual enthalpy in core samples to verify crosslinking completion. Uncured resin exhibits a distinct exothermic peak during dynamic re-heating runs; comparing residual enthalpy against uncured matrix enthalpy yields absolute conversion percentage values.

Non-Destructive Spectroscopic and Mechanical Conversion Diagnostics
Non-destructive evaluation techniques offer methods for verifying structural integrity without damaging finished tooling structures. Ultrasonic velocity measurement tracks modulus development and void accumulation across thick sections. Ultrasonic shear wave propagation velocity increases predictably as liquid resin converts into a solid network, providing real-time data on the internal gelation state.
| Diagnostic Method | Primary Target Parameter | Core Penetration Depth | Measurement Accuracy |
|---|---|---|---|
| Residual Enthalpy DSC | Absolute Conversion State (alpha) | Destructive Coupon Sample | +/- 0.8 Percent Conversion |
| Dynamic Mechanical Analysis | Glass Transition Temperature (Tg) | Destructive Coupon Sample | +/- 1.2 Degrees Celsius |
| Ultrasonic Shear Velocity | Viscoelastic Modulus Evolution | Up to 150 mm Section Thickness | +/- 3.5 Percent Modulus |
| Dielectric Cure Monitoring | Ion Viscosity and Gel Point | Embedded Sensor Location | Real-time Trend Tracking |
| X-ray Computed Tomography | Internal Microcracking / Voids | Up to 80 mm Composite Section | 5 Micron Feature Resolution |

Thermal Profile Verification and Acceptance Thresholds
Establishing rigorous quality acceptance criteria protects downstream composite manufacturing operations from tooling failure. Embedded thermocouple logs collected during cure cycles must prove core temperatures stayed within allowable processing windows. Standard acceptance criteria require achieving minimum conversion thresholds of 0.92 for intermediate holds and 0.96 following final post-cure processing.
Tooling qualification guidelines require verifying that glass transition temperatures exceed maximum part cure processing temperatures by at least 25 degrees Celsius. Experiencing glass transition degradation during production causes vacuum bag sealing loss, tool dimensional drift, and structural part rejection. Embedded fiber-optic Bragg grating sensors permanently integrated into tool substructures monitor strain accumulation throughout the service lifecycle.
Core micro-hardness measurements mapped across section thickness provide direct physical proof that crosslink density satisfies structural tooling requirements.