Metrology Protocol Standardization for Micro-Molded Component Acceptance Inspections
Standardizing micro-molded part metrology requires matching sensor physics to resin translucency and establishing guardbanded decision rules across labs.


Optic
When micro-molded features drop below two hundred micrometers, tactile styli risk flexing elastic resins, while optical systems run into severe light dispersion. High-aspect features like fluidic channels in diagnostic chips or micro-pin arrays on electrical connectors require non-contact coordinate measuring machines ~ typically multi-axis optical heads, white-light interferometers, or video measuring systems. Choosing the right sensor geometry, magnification ratio, and illumination spectrum determines whether receiving inspection flags an actual out-of-spec dimension or simply records refraction artifacts.
Vision systems find component boundaries by tracking contrast transitions across pixel arrays. On opaque parts like carbon-filled polyetheretherketone (PEEK), high material contrast lets edge-detection routines repeat down to sub-micron thresholds. Micro-molding, however, relies heavily on semi-crystalline and amorphous resins ~ such as liquid crystal polymers (LCP), polyoxymethylene (POM), and cyclic olefin copolymers (COC) ~ where light behaves quite differently.
Translucent polymers absorb incident rays and scatter photons beneath the surface before reflecting them to the sensor. This volumetric scattering softens boundaries, pushing calculated edges inward or outward depending on backlight polarization and threshold settings. On unpigmented polycarbonate micro-vials, optical edge detection calibrated against opaque chrome-on-glass targets misreads inner wall diameters by up to twelve micrometers.

Image Sensor Resolution and Boundary Refinement
Resolving sub-millimeter features requires high numerical aperture objectives that achieve spatial resolutions near five hundred nanometers per pixel, but higher magnification shrinks the field of view. A ten-times magnification lens covers less than two millimeters across. Capturing a four-millimeter micro-molded part therefore requires image stitching or continuous stage travel, where stage positioning inaccuracies compound with peripheral lens distortion to introduce spatial noise.
Telecentric lenses prevent apparent size shifts when parts move vertically within the depth of field. While conventional optics alter image scale as features shift relative to the front lens, telecentric configurations hold magnification constant across a narrow depth ~ often under one millimeter at higher magnifications. Draft angles or subtle sink marks complicate this by causing the focal plane to intersect differing part depths, washing out edges under bright light.
Setting a repeatable focal plane requires contrast-maximization autofocus or secondary laser triangulation, where a laser spot cast onto the resin surface locks the vertical stage within two hundred nanometers before image capture.
Physical contact datums introduce seven micrometers of parasitic displacement when measured on unreinforced resin components under standard clamp loads.

Translucency Effects in Micro Fluidic Substrates
Optical depth bias is an inherent challenge with transparent polymers. Illumination penetrates thin micro-fluidic channel walls, reflecting off rear internal surfaces or underlying fixtures to cast overlapping reflections into the sensor. Coaxial illumination sends light straight down through the objective, whereas ring lighting strikes at an oblique angle.
Setting ring lights between fifteen and forty-five degrees suppresses internal reflections while preserving contrast along the surface walls.
Light penetration into cyclic olefin copolymer creates a four-micrometer virtual edge shift. Standard edge-detection routines locate the steepest grayscale slope along a profile line, but on translucent resins that peak drifts inward as light bleeds across the boundary. Standardizing optical acceptance tests means setting fixed gray-level threshold percentages or turning to sub-pixel edge extraction built on second-derivative zero-crossing models.
Switching from broadband white light to single-wavelength narrow-band green or blue light emitting diodes also cuts chromatic aberration and restricts penetration depth, yielding cleaner edges.
Attributing edge variation to tool-wear surface roughness rather than an out-of-spec part geometry shifts the source of measurement variance back onto the acceptance protocol.


Datum
Establishing repeatable coordinate systems on micro-molded parts is rarely straightforward. Standard geometric dimensioning and tolerancing (GD&T) schemes rely on primary, secondary, and tertiary datums established by physical contact on planes or cylinders. Yet micro-molded components rarely present true planar faces because of differential cooling, non-uniform volumetric shrinkage, and draft angle requirements.
A part two millimeters across can easily show three micrometers of micro-bowing along its primary base, making three-point planar contact unstable.
Parting line flash, gate vestiges, and ejector marks introduce further reference errors. Cavity injection pressures exceeding one thousand bar can push small amounts of melt into parting line vents, leaving flash between one and fifteen micrometers thick. Landing a physical probe or optical datum target directly on this flash tilts the reference plane, projecting angular error across every downstream feature coordinate.

Parting Line Distortions and Reference Geometry
Physical datum targets must stay clear of tool splits and ejector positions. Inspection protocols should define compact, explicit target zones on drawings instead of referencing entire functional faces. Calling out a datum target as a zero-point-five millimeter diameter circle isolated from parting lines gives both molder and customer an unambiguous reference location.
Virtual alignment sidesteps mechanical fixturing issues. Structured-light micro-topography sensors and optical CMMs capture dense point clouds containing millions of surface points, allowing metrology software to construct reference frames against nominal Computer-Aided Design (CAD) geometry. Unconstrained best-fit routines float the cloud freely to minimize average global deviation, but that approach masks localized functional flaws and violates ASME Y14.5 rules.
A constrained mathematical alignment locks degrees of freedom sequentially: the primary datum constrains three spatial degrees of freedom, the secondary secures two, and the tertiary takes out the final translation.
The alignment method chosen directly drives pass-fail outcomes during incoming inspection. Table 1 compares common alignment models used for micro-molded components, showing how reference setups alter measured geometric variance.
| Alignment Method | Constrained Degrees of Freedom | Sensitivity to Parting Line Flash | Positional Repeatability (µm) | Computational Latency per Part |
|---|---|---|---|---|
| Physical 3-2-1 Contact Fixturing | 6 (Mechanical constraint) | Extreme (>10 µm error shift) | ±3.8 | 45 seconds |
| Unconstrained CAD Best-Fit | 0 (Global error minimization) | Low (Averages localized flash) | ±1.2 | 4 seconds |
| Constrained Surface Target Matching | 6 (Mathematical sequential lock) | Filtered via geometric masks | ±0.4 | 12 seconds |
| Iterative Closest Point (ICP) Freeform | 6 (Least-squares alignment) | Moderate (Requires noise thresholding) | ±0.9 | 18 seconds |

Constrained Alignment Protocols for Sub Millimeter Parts
Inspection protocols require unambiguous mathematical definitions for point cloud alignment. Because different metrology platforms apply their own sampling rates, convergence rules, and outlier rejection filters, specifying constrained minimum-zone alignment in one software package will not match standard least-squares fitting in another. The inspection specification has to fix the algorithm type, iteration limits, and filtering thresholds.
Tooling artifacts require masking before establishing coordinate systems. Ejector pins leave shallow depressions or raised perimeter rims that must be filtered out within set radii around known pin and parting line locations. Excluding these regions ensures that reference calculations reflect functional mating surfaces rather than the mechanics of mold release.
- Ejector Pin Impression Overhang ~ Localized shear stress alters primary planar contact surfaces by three to seven micrometers.
- Parting Line Flash Shear ~ Resin buildup along mold splits disrupts edge tracking and rotates secondary reference vectors.
- Thermal Shrinkage Asymmetry ~ Differential cooling across thin walls induces micro-bowing that upsets 3-point planar fixturing.
- Gate Vestige Protrusion ~ Residual material at injection gates forms unintended high points during physical contact.
ASME Y14.5.1M clause 4.2 requires constrained mathematical datum construction, mandating that suppliers filter out parting line artifacts before evaluating features.

Probe
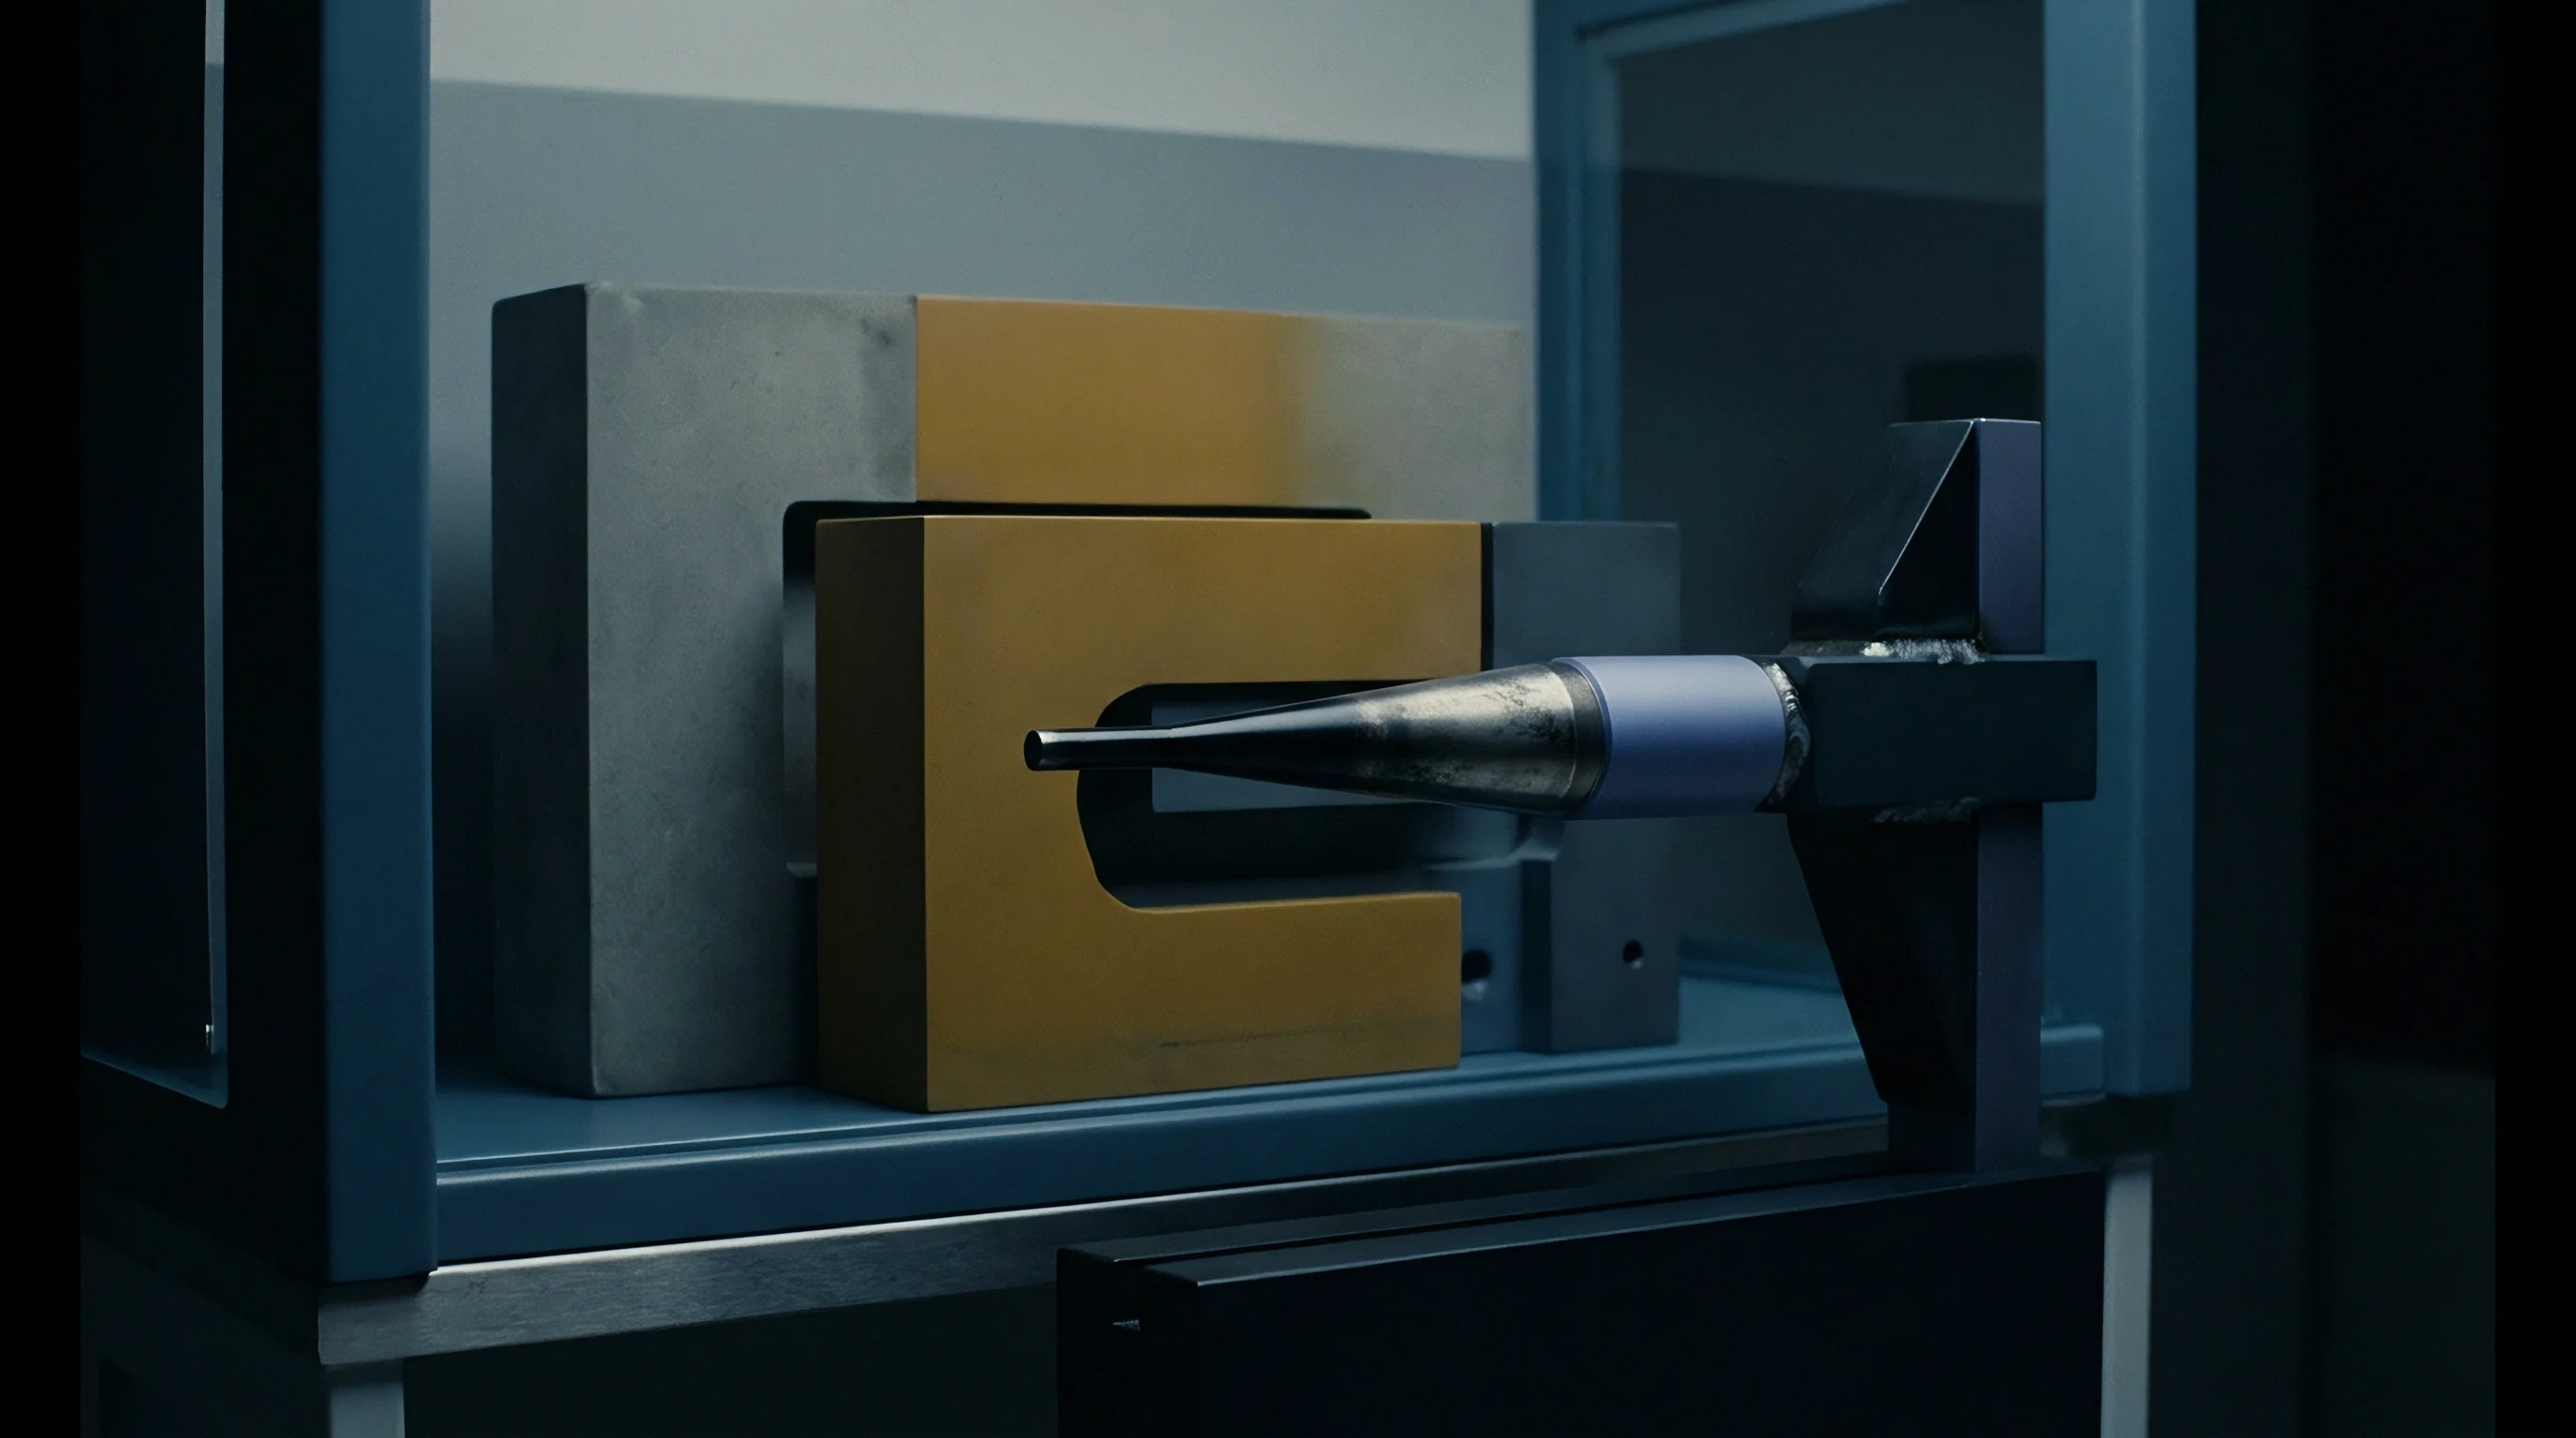
Tactile metrology on micro-molded parts requires extreme precision in probe force control and stylus geometry selection. Conventional touch-trigger CMMs operate at contact forces between zero-point-two and one-point-five Newtons. On a fifty-micrometer PEEK or polypropylene wall, that load flexes the feature and indents the resin surface, yielding measured dimensions smaller than the actual part.
Micro-tactile systems drop contact loads to millinewton or micro-Newton thresholds, using piezoresistive, optical deflection, or resonant frequency sensors to register contact below five millinewtons. Controlling force at this level prevents local yielding and keeps delicate features from bending during acquisition. These low forces, however, depend on micro-styli fitted with ruby or silicon nitride spheres down to fifteen micrometers in diameter.
Because these slender shafts have minimal bending stiffness, higher approach speeds induce shaft flexure that registers as vector error.

Tactile Stylus Deformation under Low Load Metrology
Calibrating micro-stylus deflection takes particular care. Standard calibration procedures scan reference spheres to calculate deflection correction matrices within the controller software. Static friction between the sphere and the polymer can also cause probe stick-slip during continuous scanning.
In addition, molded parts easily hold static charges, residual mold release, or airborne dust that transfers to the tip. A single two-micrometer particle clinging to a thirty-micrometer stylus sphere shifts measured values by over six percent on sub-hundred-micrometer features.
Measurement routines should include automated tip cleaning or optical inspection of the stylus sphere at fixed run intervals. Maintaining an ISO Class 7 or better cleanroom controls the particulate contamination that settles on parts and probes alike.

Can Computed Tomography Replace Tactile Micro Probing?
Industrial X-ray Computed Tomography (micro-CT) provides a volumetric, non-destructive route for inspecting complex micro-moldings. Rotating a part through three hundred and sixty degrees while gathering hundreds of 2D X-ray projections allows reconstruction software to assemble a 3D voxel grid. Because it sidesteps physical contact deflection and optical line-of-sight constraints, micro-CT suits micro-fluidic assemblies with buried channels, undercuts, and enclosed radii.
Voxel size, tube focal spot dimensions, and detector pitch dictate micro-CT resolution. Reaching voxel resolutions below one micrometer requires positioning the component close to the X-ray source, making part envelope the practical limit on magnification. Resin density determines contrast: unfilled polymers like polypropylene attenuate X-rays weakly, yielding far lower contrast than glass-filled or radiopaque grades.
Standardizing micro-CT metrology depends heavily on surface-determination algorithms that locate boundaries from gray-value transitions across voxels. A fixed global threshold misidentifies edges if beam hardening or scatter is present, making localized, gradient-based edge models necessary to evaluate density shifts across adjacent voxel neighborhoods.
- Mount the micro-molded component inside the temperature-controlled optical enclosure and allow fifteen minutes to reach thermal equilibrium.
- Zero the sensor against a certified ruby calibration sphere with diameter known to within fifty nanometers.
- Execute a five-hundred-point optical edge scan to establish initial rough coordinate orientation vectors.
- Take single-point tactile measurements at designated target sites using a ten-milligram contact probe tip.
- Run point-cloud reconstruction filtering to strip out spurious points caused by settling dust particles.
Uncertainty profiles vary widely by inspection method. Table 2 outlines primary uncertainty drivers across optical, micro-tactile, and micro-CT metrology systems applied to micro-molded component verification.
| Uncertainty Parameter | Video Optical Metrology | Micro-Tactile CMM | X-ray Computed Tomography |
|---|---|---|---|
| Primary Physics Constraint | Optical diffraction & translucency | Elastic contact deformation | Voxel resolution & focal spot blur |
| Typical Expanded Uncertainty (U, k=2) | ±1.8 µm | ±0.6 µm | ±2.5 µm |
| Environment Thermal Sensitivity | Low (Short cycle time) | Moderate (Frame drift) | High (Long scan times 30–120 min) |
| Calibration Standard Traceability | Chrome-on-glass grid | Ruby sphere array | Calibrated wire gauge / sphere bar |
| Feature Accessibility | Line-of-sight limited | Line-of-sight & aspect ratio limited | Full volumetric (Internal + External) |
Gauge Repeatability and Reproducibility (Gauge R&R) studies on micro-features require isolating each platform’s distinct uncertainty drivers.
ISO 10360 part 8 requires full spatial calibration across the active measurement volume to prevent off-axis interpolation errors.
The buyer incurred forty-two thousand dollars in expedited freight and re-testing charges when a supplier calibrated micro-tactile styli against macro standards, masking a nine-micrometer systematic error.


Drift
Dimensions of micro-molded polymer components change dynamically following ejection from the mold tool. Thermoplastic resins undergo volumetric shrinkage from thermal contraction and ongoing polymer chain crystallization. While amorphous polymers like polycarbonate settle rapidly within hours, semi-crystalline polymers like POM, PEEK, and nylon undergo secondary crystallization cycles that continue for days or weeks post-molding.
Measuring a semi-crystalline micro-component one hour after production yields different spatial results than measuring that same component forty-eight hours later.
Viscoelastic stress relaxation introduces additional geometric shifts over time. High injection speeds and aggressive shear align molecular chains along flow lines during cavity filling, and rapid cooling freezes these uncoiled chains in place. As frozen-in orientation stresses relax over time, parts suffer subtle warpage, post-mold bowing, or dimensional drift.
Standardizing acceptance inspection protocols therefore requires strict conditioning hold times prior to formal dimensional verification.

Viscoelastic Relaxation Dynamics in Molded Resins
Hygroscopic polymers absorb ambient atmospheric moisture, inducing volumetric swelling. Nylon 66 micro-components, for example, absorb up to two-point-five percent water by weight under ambient laboratory conditions. Moisture acts as a plasticizer, expanding intermolecular spacing and increasing physical part dimensions by several micrometers per millimeter of length.
Inspecting dry, as-molded nylon parts immediately after production can yield non-conforming results when judged against drawings modeled on fully moisture-equilibrated components.
Inspection procedures must specify exact temperature and humidity conditioning guidelines prior to measurement. Standardizing on ISO 291 class 1 conditioning environments—twenty-three degrees Celsius and fifty percent relative humidity—ensures parts achieve equilibrium moisture content before metrology execution. Unconditioned micro-components transferred directly from hot molding operations into cool inspection laboratories undergo thermal shocks that compromise measurement accuracy.

Thermal Expansion Multipliers across Measurement Environments
Thermal expansion effects amplify rapidly at sub-millimeter scales due to the high coefficients of thermal expansion (CTE) inherent to engineering polymers. Unfilled PEEK exhibits a CTE of approximately forty-five parts per million per degree Celsius, whereas aluminum CMM structural frames exhibit twenty-three PPM per degree, and steel fixtures exhibit eleven PPM per degree. A temperature delta of five degrees Celsius between the molding floor and metrology laboratory alters a two-millimeter PEEK feature by over zero-point-four micrometers.
While zero-point-four micrometers sounds small in absolute magnitude, it represents eight percent of a five-micrometer total tolerance band.
High-precision cleanroom metrology environments maintain ambient temperatures within twenty degrees Celsius, plus or minus zero-point-one degree. Standard laboratory controls operating within plus or minus two degrees Celsius allow thermal fluctuations that swamp sensor accuracy limits. Operators handling parts with bare hands or standard tweezers transfer body heat directly into micro-components, expanding tiny polymer features within seconds.
Metrology protocols must stipulate non-thermal-conductive handling tools, such as vacuum wands or ceramic-tipped tweezers, and mandate part thermal soak intervals on aluminum thermal-stabilization plates inside the metrology enclosure prior to measurement.
Component dimensions stabilize only after polymer chain relaxation completes and internal molding stresses fully dissipate.
Establishing ambient hold requirements requires monitoring cleanroom thermal swings at receiving facilities.
How long metrology teams must hold hygroscopic resins in conditioned environments before dimensional shifts fall below background sensor noise remains unsettled across international standards.


Contract
Standardizing acceptance metrology requires harmonizing commercial contracts and receiving quality procedures between suppliers and buyers. Discrepancies between supplier and buyer inspection data routinely stem from mismatched measuring equipment, conflicting alignment software, varying ambient conditions, and differing operator techniques. These measurement gaps trigger unnecessary batch rejections, delayed product launches, and costly commercial disputes.
ISO 14253 part 1 establishes fundamental rules for proving conformity or non-conformity with specifications, mandating that measurement uncertainty be deducted directly from specified tolerance limits when proving compliance. This practice, known as guardbanding, reduces the functional acceptance zone by the expanded measurement uncertainty value. High measurement uncertainty shrinks the usable engineering tolerance range, forcing molders to hold tighter manufacturing limits than originally required by part design.
Guardbanding Strategy for Sub Micron Tolerances
Guardbanding protects the buyer from accepting non-conforming parts (Consumer Risk / Type II Error) by shifting acceptance limits inward by a factor equal to the expanded uncertainty (U). If a micro-pin feature carries a specified diameter tolerance of one hundred micrometers plus or minus five micrometers (ninety-five to one hundred and five micrometers), and combined measurement uncertainty equals one micrometer, the guardbanded acceptance zone narrows to ninety-six to one hundred and four micrometers. Molders producing parts measuring ninety-five-point-three micrometers pass absolute drawing specs but fail guardbanded acceptance tests.
Commercial acceptance agreements must define guardband strategies explicitly before tool build sign-off. ISO 14253-1 permits default or custom guardbanding agreements: buyers and suppliers may agree to share measurement risk equally by placing default acceptance decision boundaries directly at the engineering specification limits, provided the measurement uncertainty ratio (TUR) remains higher than four to one. When TUR falls below four to one, formal guardbanding becomes mandatory to prevent out-of-tolerance components from reaching production lines.

Acceptance Sampling Rules under High Volumetric Throughput
Acceptance sampling protocols designed for macro parts fail when applied directly to high-cavitation micro-molding runs. High-cavitation molds running sixty-four or one hundred and twenty-eight cavities produce tens of thousands of micro-parts per shift, making destructive or manual off-line inspection of traditional sample sizes (such as AQL 0.65 Level II per ANSI/ASQ Z1.4) labor-intensive and prone to inspection bottlenecks.
Micro-molding programs rely on zero-acceptance-number sampling plans (C=0) combined with cavity-specific stratification routines. While traditional sampling plans permit one or two defects in a sample lot, in precision micro-molded medical assemblies a single defective micro-component causes downstream automated assembly line jams or device failures. C=0 plans reject the entire manufacturing lot if a single non-conforming part surfaces during sample verification.
Sample selection must pull parts equally across all mold cavities, as aggregating parts into bulk bins masks single-cavity damage or localized filling issues.
- Measurement Uncertainty Ratio ~ Enforce a minimum four-to-one ratio between component tolerance band and total measurement uncertainty before finalizing quality sign-off.
- Cross Lab Correlation Standard ~ Conduct paired measurement trials on twenty reference parts across buyer and seller equipment prior to commercial lot release.
- Guardband Width Specification ~ Deduct two times the combined standard uncertainty from upper and lower tolerance limits during batch acceptance testing.
- Environmental Hold Interval ~ Require a documented twenty-four-hour stabilization period in a ISO Class 7 cleanroom before lot inspection begins.
Standardizing acceptance metrology requires executing round-robin correlation studies between molder and buyer laboratories prior to production release. Golden part sets—comprising production-grade micro-molded parts spanning lower, middle, and upper tolerance limits—are measured across both facilities using identical protocol steps. Comparing dataset means and variance metrics isolates systematic equipment biases, software alignment discrepancies, and thermal offset errors before commercial manufacturing begins.
| Sampling Scheme Standard | Sample Size (Lot Size 50,000) | Acceptance Criterion | Producer Risk (Alpha) | Consumer Risk (Beta) |
|---|---|---|---|---|
| ANSI/ASQ Z1.4 Level II (AQL 0.40) | 500 parts | Accept on 5, Reject on 6 | Low (1–2%) | High on single cavity defect |
| Squeglia C=0 (AQL 0.40) | 192 parts | Accept on 0, Reject on 1 | Moderate (5–8%) | Low for lot-wide shifts |
| Stratified Cavity-Specific C=0 | 128 parts (2 per cavity) | Accept on 0 per cavity | Low (1–3%) | Minimal for localized cavity error |
| 100% Automated Optical Inline | 50,000 parts (All) | Variable threshold bounds | High (False rejections from dust) | Zero for gross geometric errors |
Purchase agreements should define explicit guardband parameters before tooling begins.
Misaligned acceptance criteria between buyer and supplier metrology labs cause more lot rejections than mold tooling errors.
Aligning measurement protocols between manufacturing and receiving sites eliminates disputes long before production molds enter commercial operation.