Establishing Dimensional Metrology Frameworks for Polymer Tooling Qualification
Polymer tooling qualification requires thermal soak logging, restrained datum fixturing, and optical translucency guardbands to guarantee cavity precision.


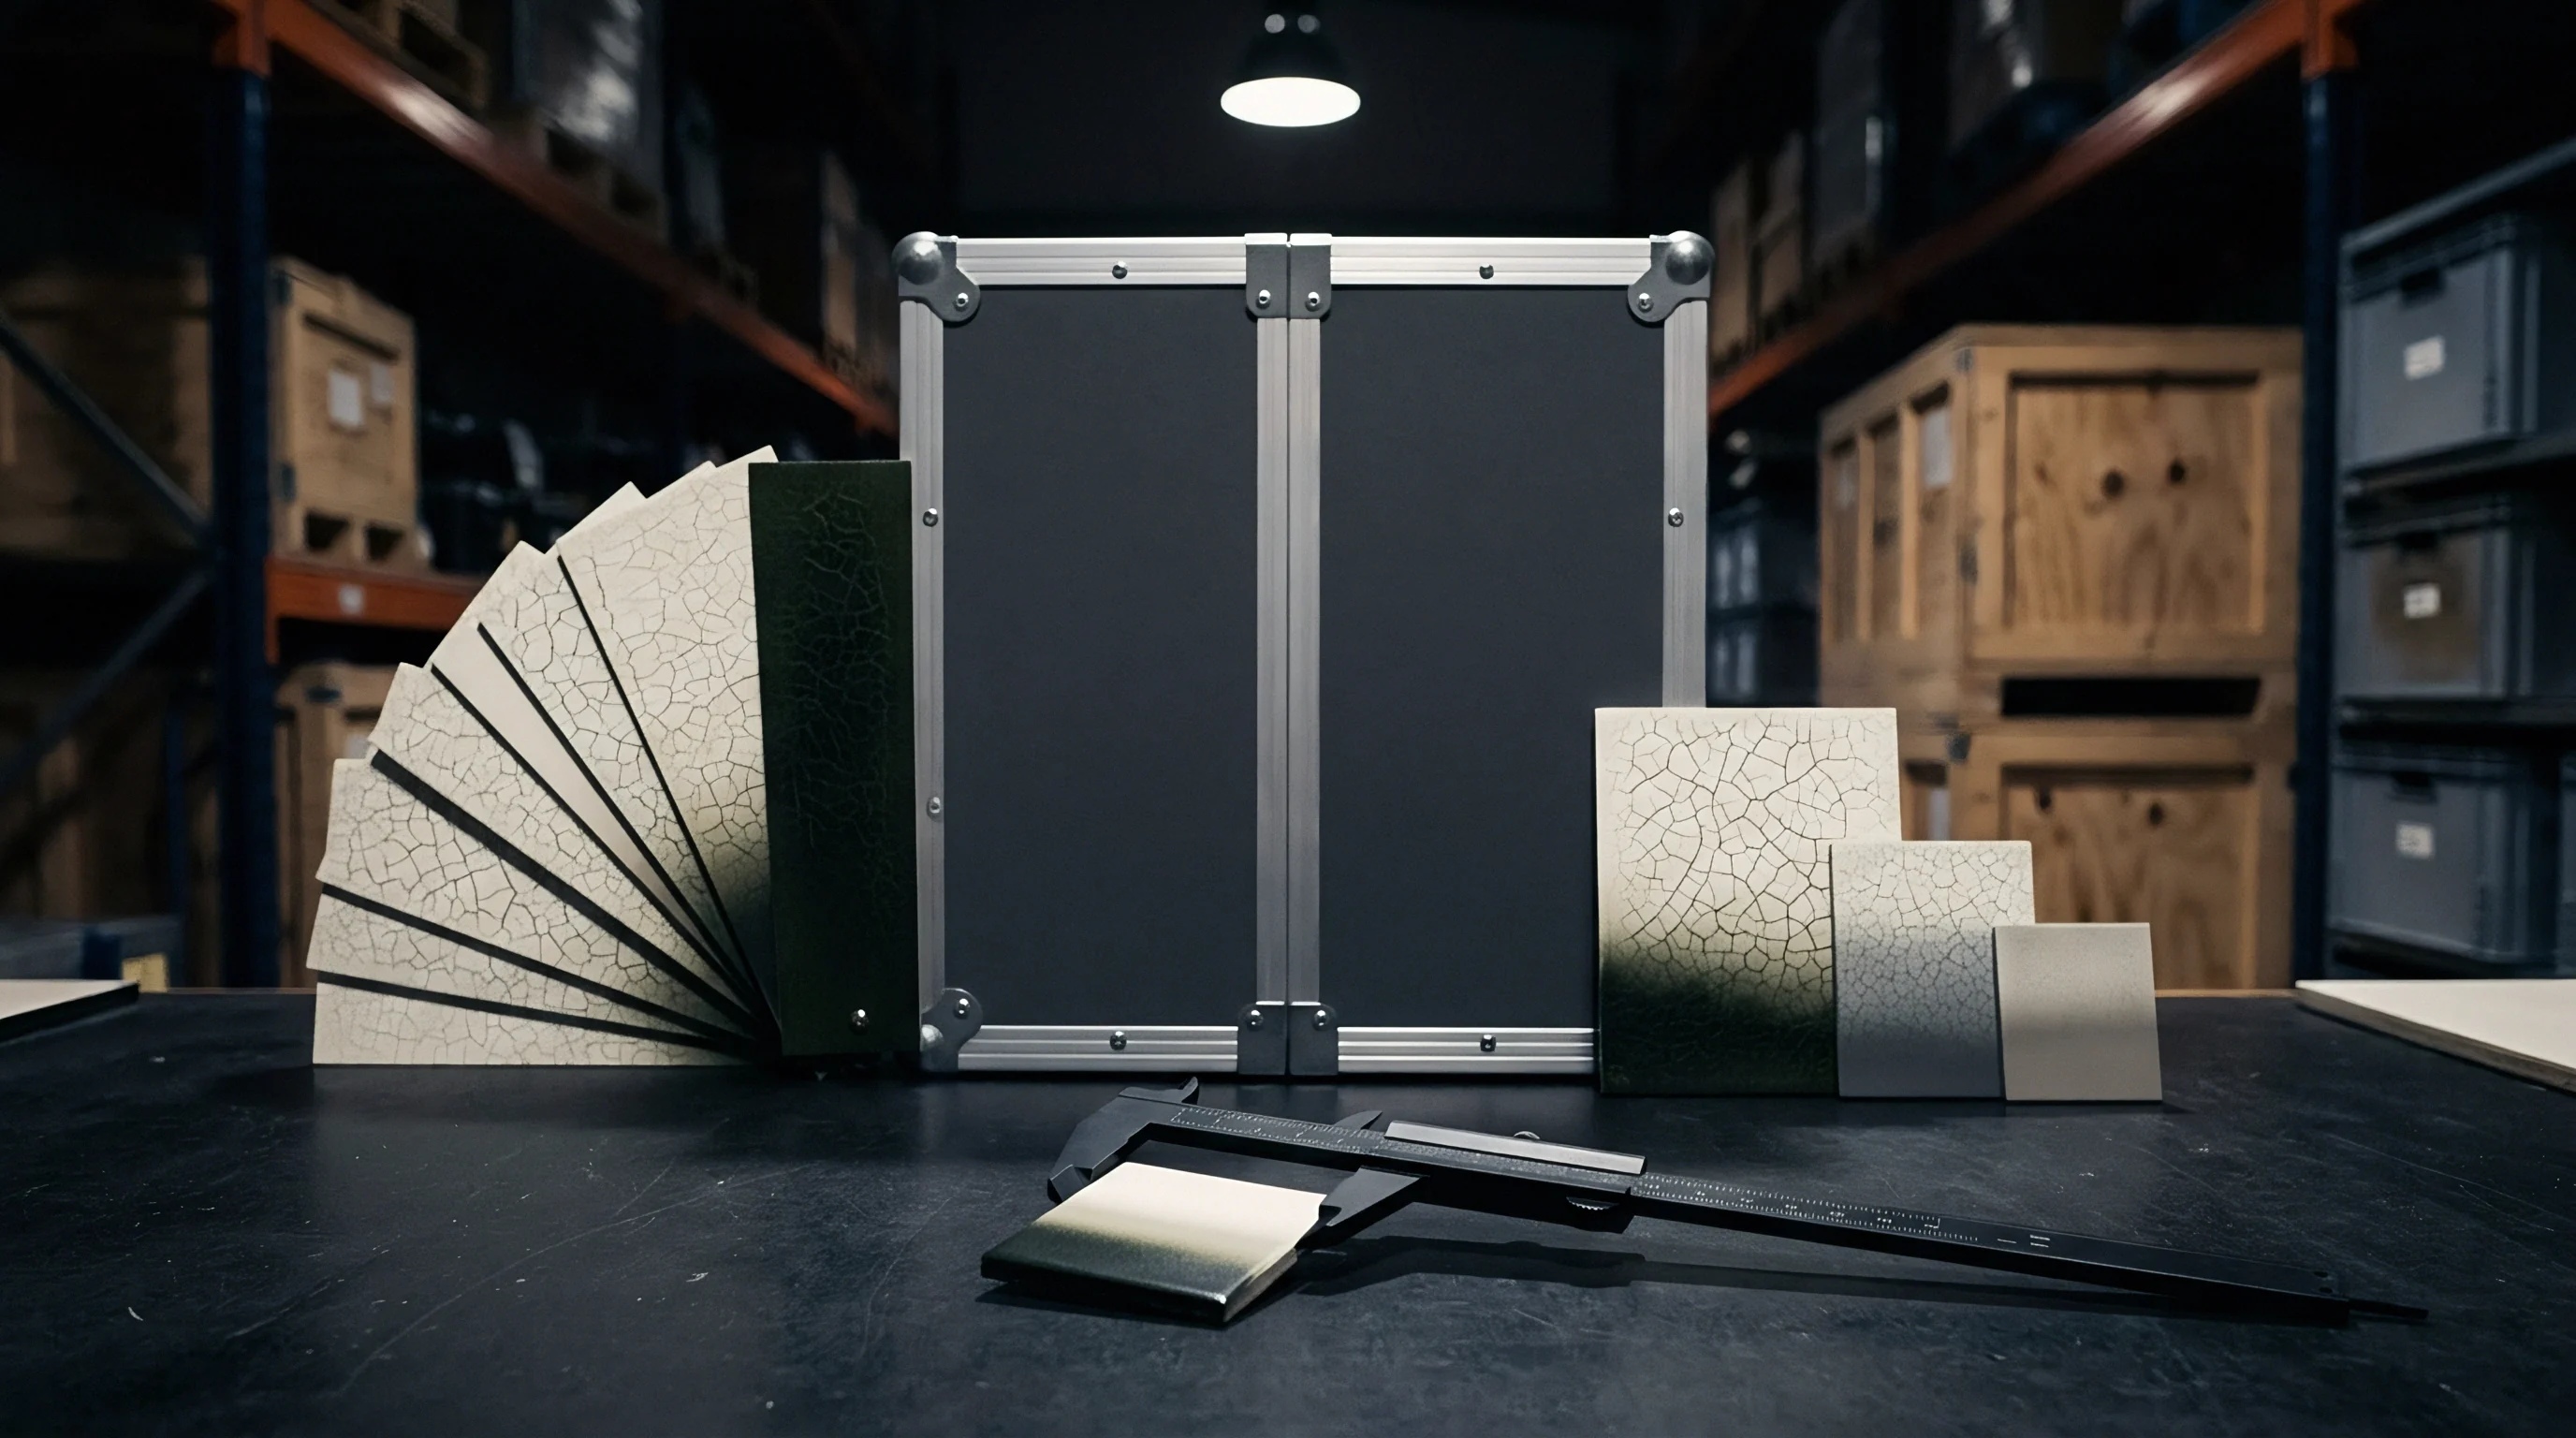
Shrink
Polymer tooling media expand and contract up to ten times faster than tool steel, driving rapid dimensional changes during coordinate inspection. Routine lab temperature swings cause liquid resins, polyurethane boards, and short-fiber composites to drift enough to invalidate standard metal inspection protocols. Transferring a synthetic mold insert directly from a CNC mill to a CMM bed creates sharp thermal gradients: the outer skin cools rapidly while the core retains machining heat, distorting the measured surface profile.
Accurate measurement depends on bringing the entire tool to thermal equilibrium before establishing datums or checking feature tolerances.
Thermal diffusivity in polymers, whether filled or unfilled, runs orders of magnitude lower than in steel or aluminum. A fifty-millimeter thick carbon-fiber reinforced epoxy block needs hours of soak time to reach equilibrium in a standard twenty-degree-Celsius room. Readings taken during this stabilization window capture thermal movement rather than true part geometry.
Expansion is rarely isotropic, either ~ compression molded boards and additively printed structures expand unevenly based on fiber alignment, polymer chain orientation, and internal voids.
Measuring a polymer mold before its core reaches thermal equilibrium records room temperature changes instead of tool geometry.
Dimensional drift during thermal stabilization distorts cavity features and mounting locations. An unreinforced polyetheretherketone insert subject to a five-degree-Celsius swing can shift beyond allowable tooling tolerances. Because machine shops typically run warmer than climate-controlled metrology labs, moving a polymer block between them induces thermal drift that mimics machining errors.
Adjusting cutter compensation off un-stabilized measurement data risks machining actual errors into a stable block.
Matrix cross-linking density dictates how synthetic media react to thermal shifts. Thermoset epoxies may continue cross-linking when heated by high-speed milling, altering density and part dimensions over time. Thermoplastics undergo viscoelastic relaxation as locked-in stresses from extrusion or printing slowly dissipate, twisting surfaces and shifting hole locations regardless of room temperature.
Separating thermal expansion from stress relaxation requires logging coordinate data across scheduled holding intervals.
Internal heat trapped inside polymer blocks requires dedicated soak time to dissipate, while ambient heat from overhead lighting can distort surface dimensions enough to corrupt measurement data.
Establishing baseline thermal stability requires monitoring both ambient room conditions and internal core temperature. Thermocouples inserted into auxiliary locator holes track thermal balance through the depth of the slab. Inspection protocols ought to specify stabilization thresholds ~ typically waiting until the core’s rate of temperature change drops below one-tenth of a degree Celsius per hour before initiating automated routines.
Skipping this step renders CAD surface profile comparisons meaningless.

Material Property Variance in Dimensional Inspection
Synthetic tooling media span several material families, each raising distinct inspection challenges. Unfilled polyurethane boards machine easily but exhibit high expansion coefficients of forty to eighty parts per million per degree Celsius. Carbon-fiber filled epoxy systems lower axial expansion to five parts per million, though transverse expansion stays as high as unfilled resin.
Additively manufactured structures from fused deposition or selective laser sintering present internal voids and anisotropic infill patterns that complicate shrinkage predictions.
| Tooling Material Class | Volumetric Expansion Rate (ppm/°C) | Thermal Diffusivity (mm²/s) | Required Thermal Soak Time per 25mm Thickness (Hours) | Isotropic Stability Index |
|---|---|---|---|---|
| High-Density Polyurethane Board | 55 – 75 | 0.12 – 0.15 | 3.5 | High |
| Carbon-Fiber Reinforced Epoxy Board | 4 – 12 (Axial) / 45 (Transverse) | 0.35 – 0.50 | 2.0 | Low (Anisotropic) |
| High-Temperature PEKK Additive Structure | 25 – 40 | 0.18 – 0.22 | 4.0 | Moderate (Layer Dependent) |
| Aluminum-Filled Epoxy Cast Resin | 30 – 45 | 0.80 – 1.10 | 1.5 | Moderate |
Metrology labs must enforce holding periods before measuring synthetic tooling inserts. Thermal stabilization procedures need to account for material class, block volume, and prior thermal exposure. Bringing a cold composite block into a warm environment causes the outer skin to expand against a cold core, bowing reference datums outward.
Checking surface parallelism during this transient state generates false out-of-spec readings that prompt unnecessary tool rework.
Temperature logs confirm that filled epoxy boards need ninety minutes per twenty-five millimeters of section thickness to stabilize internally. Cutting this soak short causes measurement errors up to zero point zero eight millimeters on core alignment features. Tying automated temperature logs into the metrology report prevents false out-of-tolerance flags caused by thermal lag.
Room logging proved the cavity wall expanded inside an uncalibrated inspection bay rather than during transit.

Probe
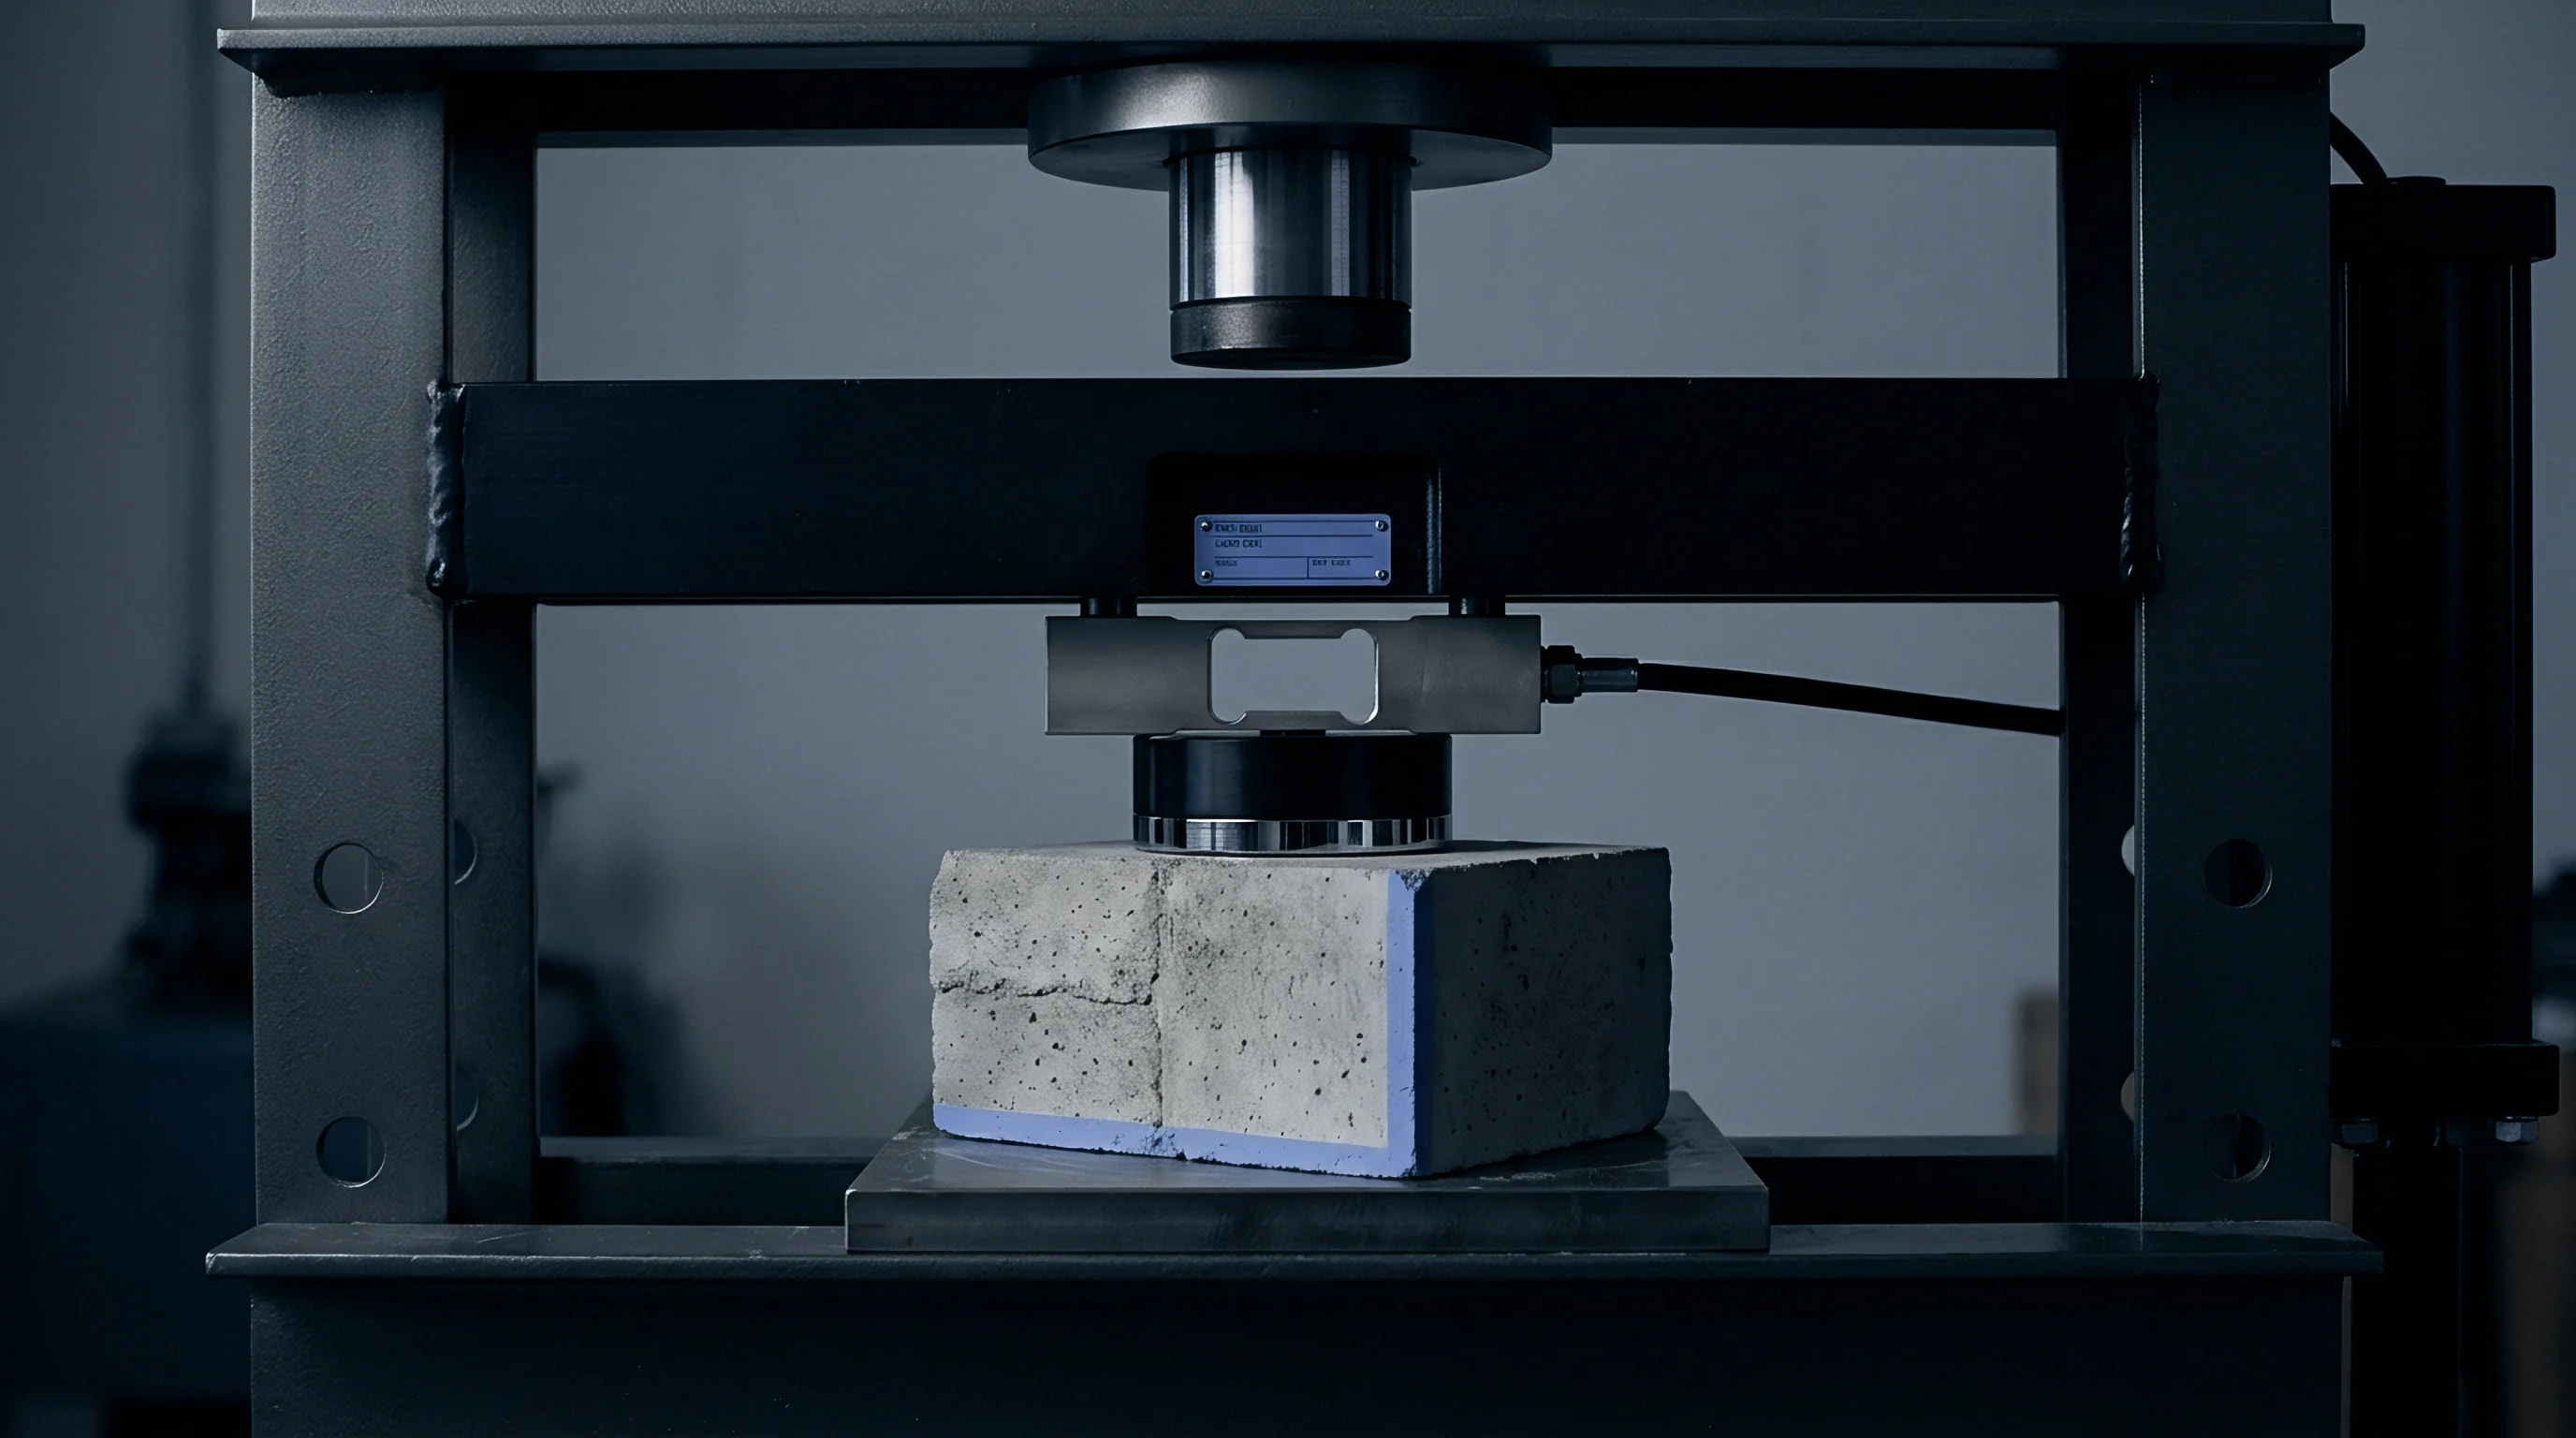
Tactile CMMs exert mechanical force that deflects soft polymer surfaces during contact measurement. Standard touch-trigger styli operating between zero point ten and zero point twenty Newtons leave micro-indentations on low-durometer polyurethane boards and unreinforced thermoplastics. Because the ruby tip depresses the surface before triggering point capture, cavity dimensions register larger and core features smaller than their true dimensions, introducing systematic error into the dataset.
Reducing contact force limits surface penetration, but can induce stylus vibration and trigger false points. Probes operating below zero point zero two Newtons require much slower scan speeds, extending cycle times on dense feature maps. Tip geometry is equally critical: small-diameter styli concentrate pressure and exacerbate matrix deformation on soft stock.
Larger spherical styli distribute contact force across a broader footprint to minimize penetration, though they risk smoothing over fine surface details required to verify mold sealing land geometry.
Applying ISO 14253-1 decision rules narrows the allowable tooling tolerance band by the expanded measurement uncertainty, shrinking the usable manufacturing window.
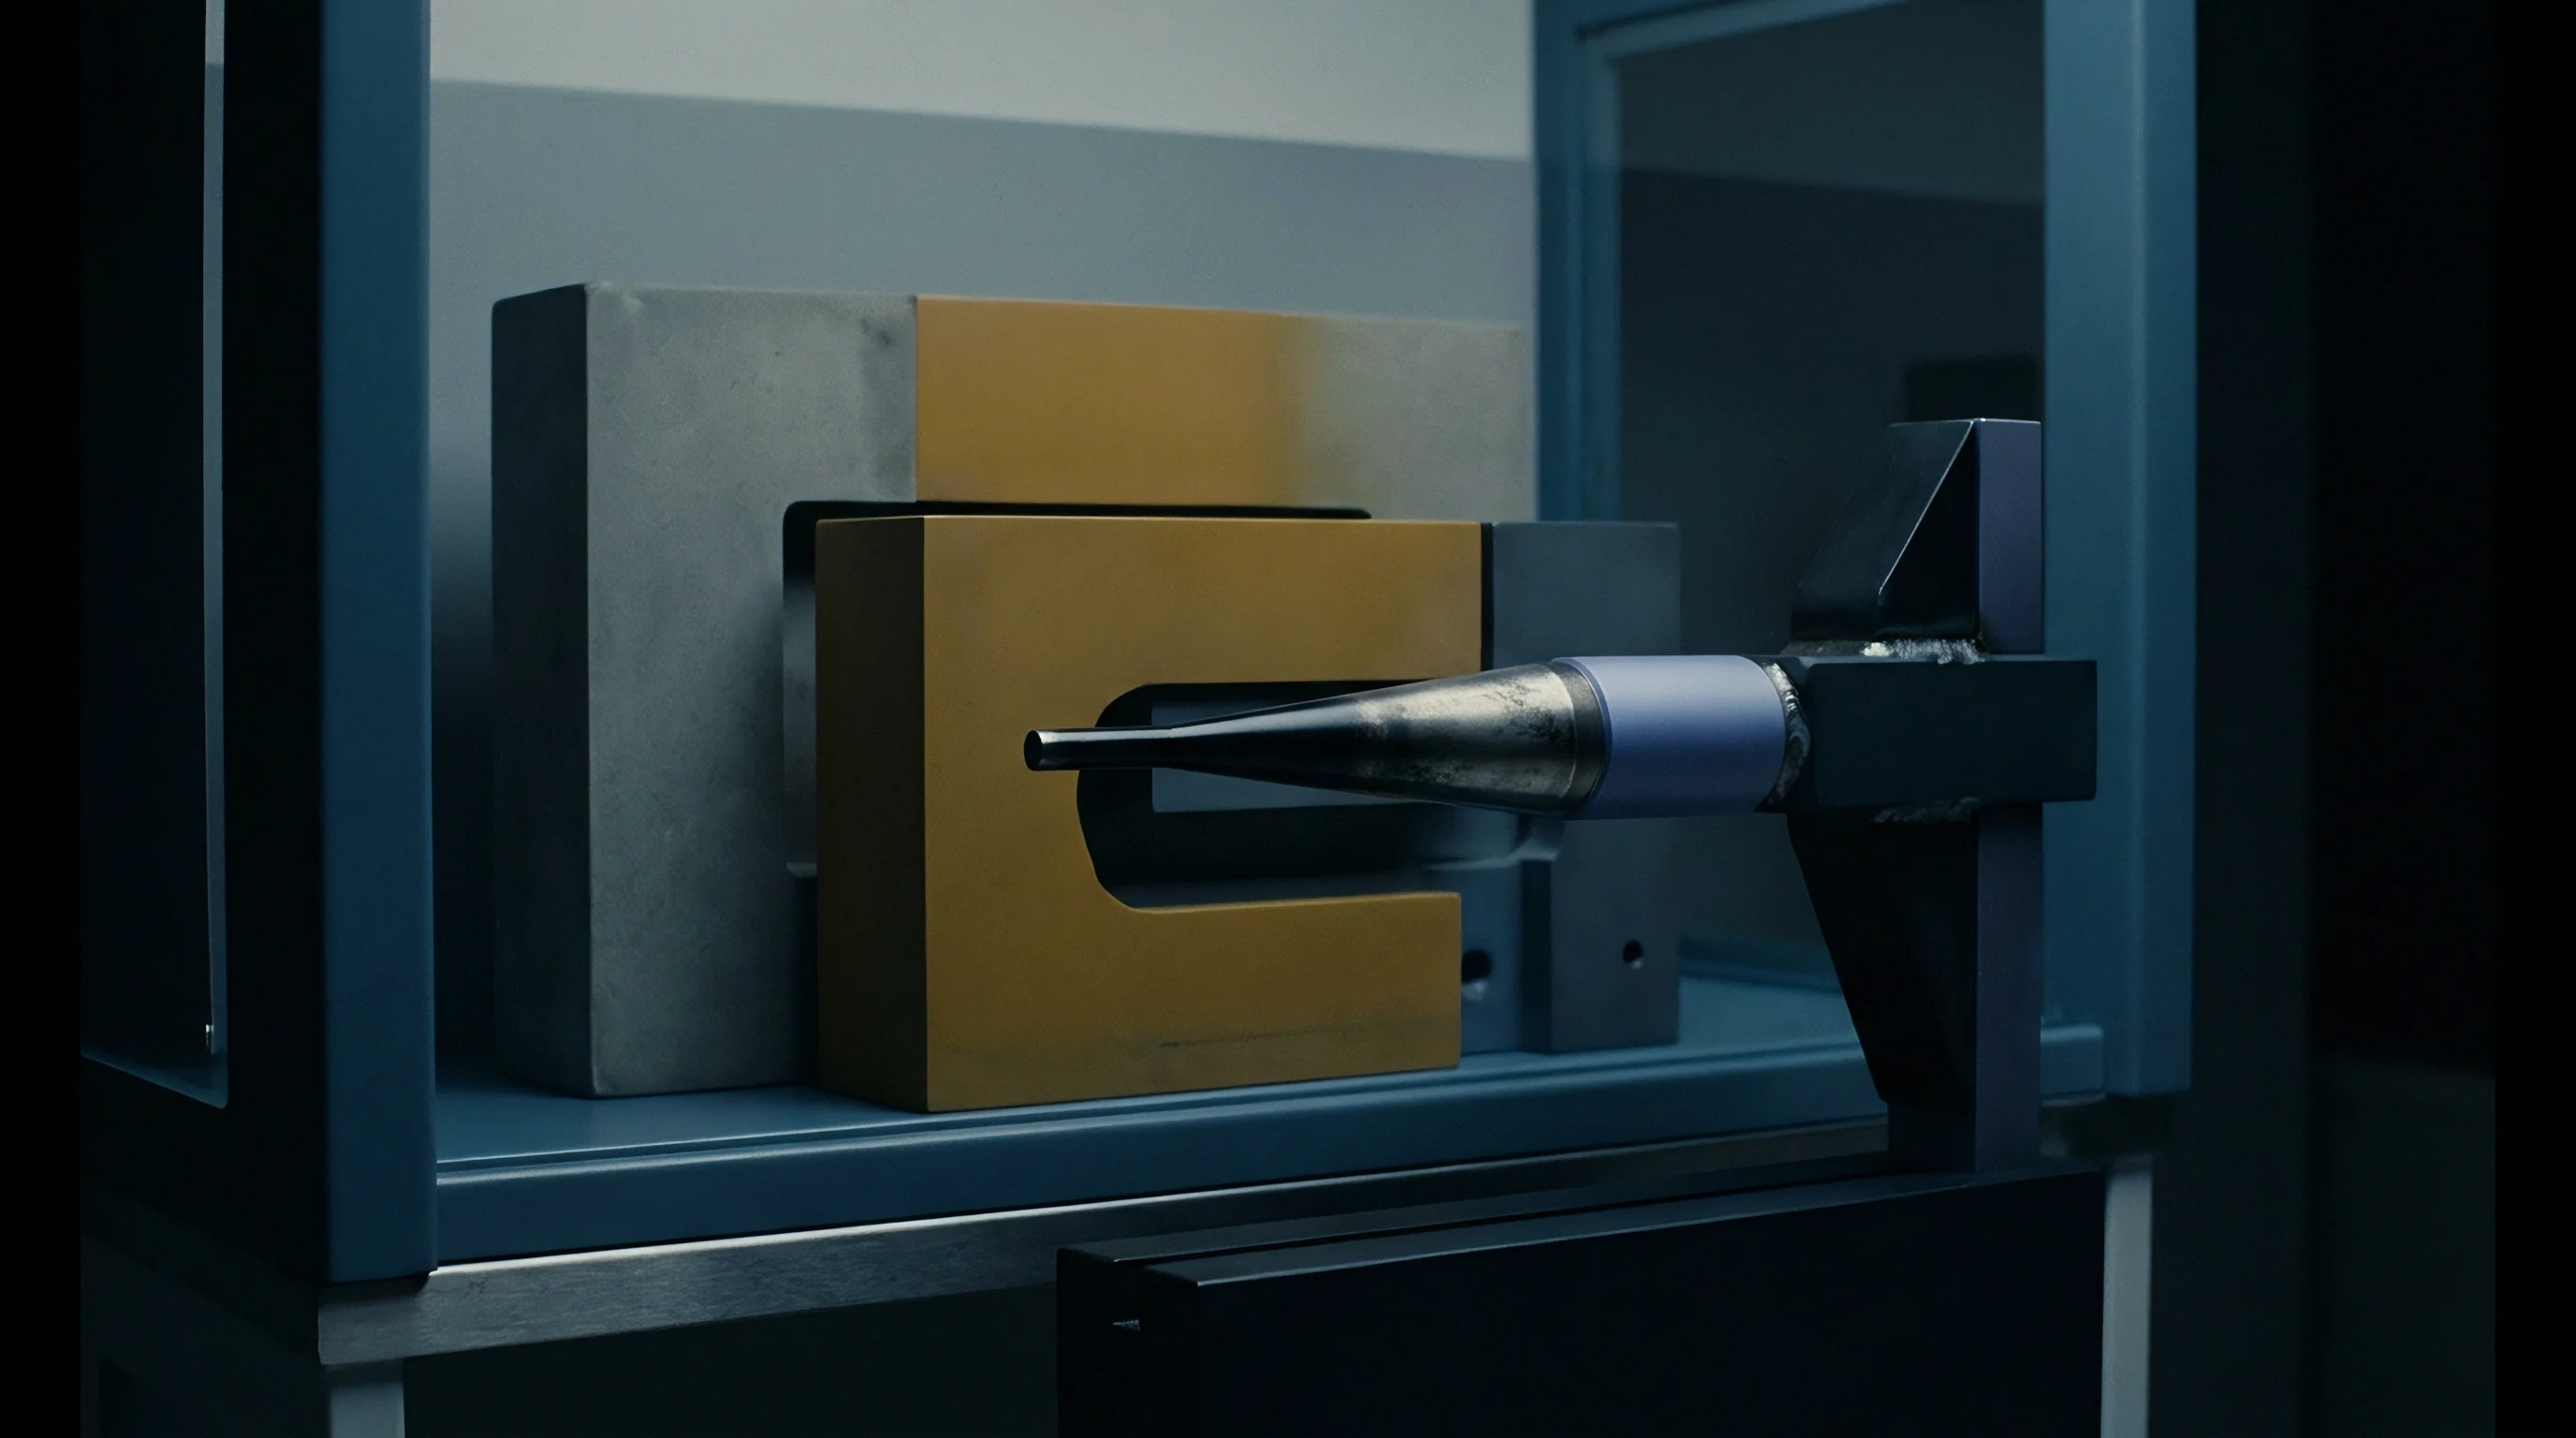
Non-contact optical metrology avoids mechanical deflection altogether during tool qualification. Laser triangulation scanners and structured blue light systems collect dense point clouds without touching the surface. Yet optical methods introduce distinct physical challenges: semi-crystalline polymers, amber epoxy resins, and dark carbon-filled compounds alter incident light through absorption, specular glare, and subsurface scattering.
While stylus pressure deforms soft board stock and introduces localized contact errors, optical sensors present their own trade-offs, often requiring surface preparation when light bleeds into translucent resin walls.
Subsurface scattering presents a persistent hurdle when scanning semi-translucent polymers. Blue and red laser lines penetrate the surface of unfilled epoxy or polyacrylamide before reflecting back to the sensor array. Because the system calculates surface position from the centroid of returned light, points register beneath the true physical boundary ~ systematically underestimating wall thickness and cavity depth.

Optical Interaction Anomalies on Polymer Surfaces
Preparing polymer surfaces for optical inspection often requires anti-glare coatings or micro-thin developer powders to establish uniform, diffuse reflection. Uncoated translucent resins allow light to penetrate the matrix, yielding noisy, scattered point clouds. Aerosol titanium dioxide or cyclododecane sprays create a temporary opaque barrier that reflects light cleanly to the cameras, though the coating thickness must be subtracted from coordinate data to preserve micron-level accuracy.
Coating thickness varies with operator technique, humidity, and standoff distance. Spray layers typically add three to fifteen micrometers to the surface, consuming valuable tolerance margin. Uneven application rounds off tight radii and introduces false surface roughness into the dataset.
Automated robotic sprayers help regulate deposition volume, maintaining repeatable film thickness across complex cavities.
- Subsurface Light Scattering creates artificial depth offsets in semi-crystalline resins when optical sensors capture light scattered from inside the matrix.
- Anti-Glare Spray Deposition introduces non-uniform coating layers between five and fifteen micrometers thick across critical cavity geometry.
- Ambient Refraction Gradients distort structured light fringes when warm polymer inserts generate thermal plumes inside the measurement volume.
- Target Displacement Errors occur when adhesive photogrammetry dots creep across compliant tool surfaces during long scan routines.
Because physical contact deforms low-modulus composites and optical sensors struggle with translucency, selecting a metrology method requires matching sensor physics to the material’s properties. Deep pockets and high-aspect-ratio rib slots frequently block optical sight lines, leading engineers to adopt hybrid strategies: using tactile probes inside tight features and optical scanners across open free-form contours.
| Metrology Sensor Technology | Surface Interaction Mechanism | Spatial Accuracy Limit (µm) | Surface Preparation Requirement | Primary Distortion Risk |
|---|---|---|---|---|
| Tactile Touch-Trigger Probe (0.1 N Force) | Direct Mechanical Contact | ± 1.5 | None (Clean Surface) | Surface Indentation / Local Deflection |
| Blue Light Structured Light Scanner | Diffuse Optical Fringe Projection | ± 5.0 | Mandatory Developer Spray on Clear Resins | Coating Thickness Variance |
| Laser Line Triangulation Probe | Coherent Light Triangulation | ± 8.0 | Optional Anti-Reflection Spray | Subsurface Scattering Penetration |
| Confocal Chromatic White Light Sensor | Spectral Wavelength Distance Mapping | ± 0.8 | None (Polished or Matte) | Refractive Index Shifts on Gloss Finish |
Adjusting sensor gain helps limit light penetration in semi-transparent resins. Reducing camera exposure while increasing light intensity forces the sensor to register primary surface reflections rather than scattered subsurface photons. These gain settings should be validated against certified step-height blocks molded from the specific resin formulation under test.
Reliable probing strategies depend on sensor-specific guardbands within the metrology software. When tactile probes measure soft polyurethane, mathematical offset algorithms compensate for Hertzian contact deformation based on tip radius and elastic modulus. For optical scans, spatial filters remove scattered points lying more than three standard deviations from the local mesh plane.
Blending contact mechanics and optical principles during system calibration maintains coordinate accuracy across synthetic tooling substrates.
Clause 6.2 of ISO 14253-1 mandates shrinking upper and lower specification limits by twice the expanded measurement uncertainty during conformance evaluations.


Rig
Mechanical restraint dictates whether a flexible polymer insert assumes its operational geometry during inspection. Unlike rigid steel blocks, polymer structures flex under self-weight, clamping force, and mounting loads. Measuring an unconstrained insert resting on a granite table yields free-state dimensions that seldom reflect how the part performs when bolted into a steel bolster plate.
ISO 10579 governs metrology practices for flexible parts, permitting tolerances to be defined in either unconstrained or restrained states. Inspection protocols must state explicitly whether tolerances apply to the free-state insert or to the component clamped under operational loads. Restraining a flexible insert during measurement calls for custom fixtures engineered to replicate production clamping forces, datum contacts, and bolt torques.
A four-point restrained tooling plate showed 0.18 millimeters of center deflection under nominal bolt torque without kinematic sub-plates.
Because gravity sags soft polymer cores and improper clamping distorts cavity dimensions, inspection datums must align with actual mold locks while fixtures isolate the part from parasitic bending forces.
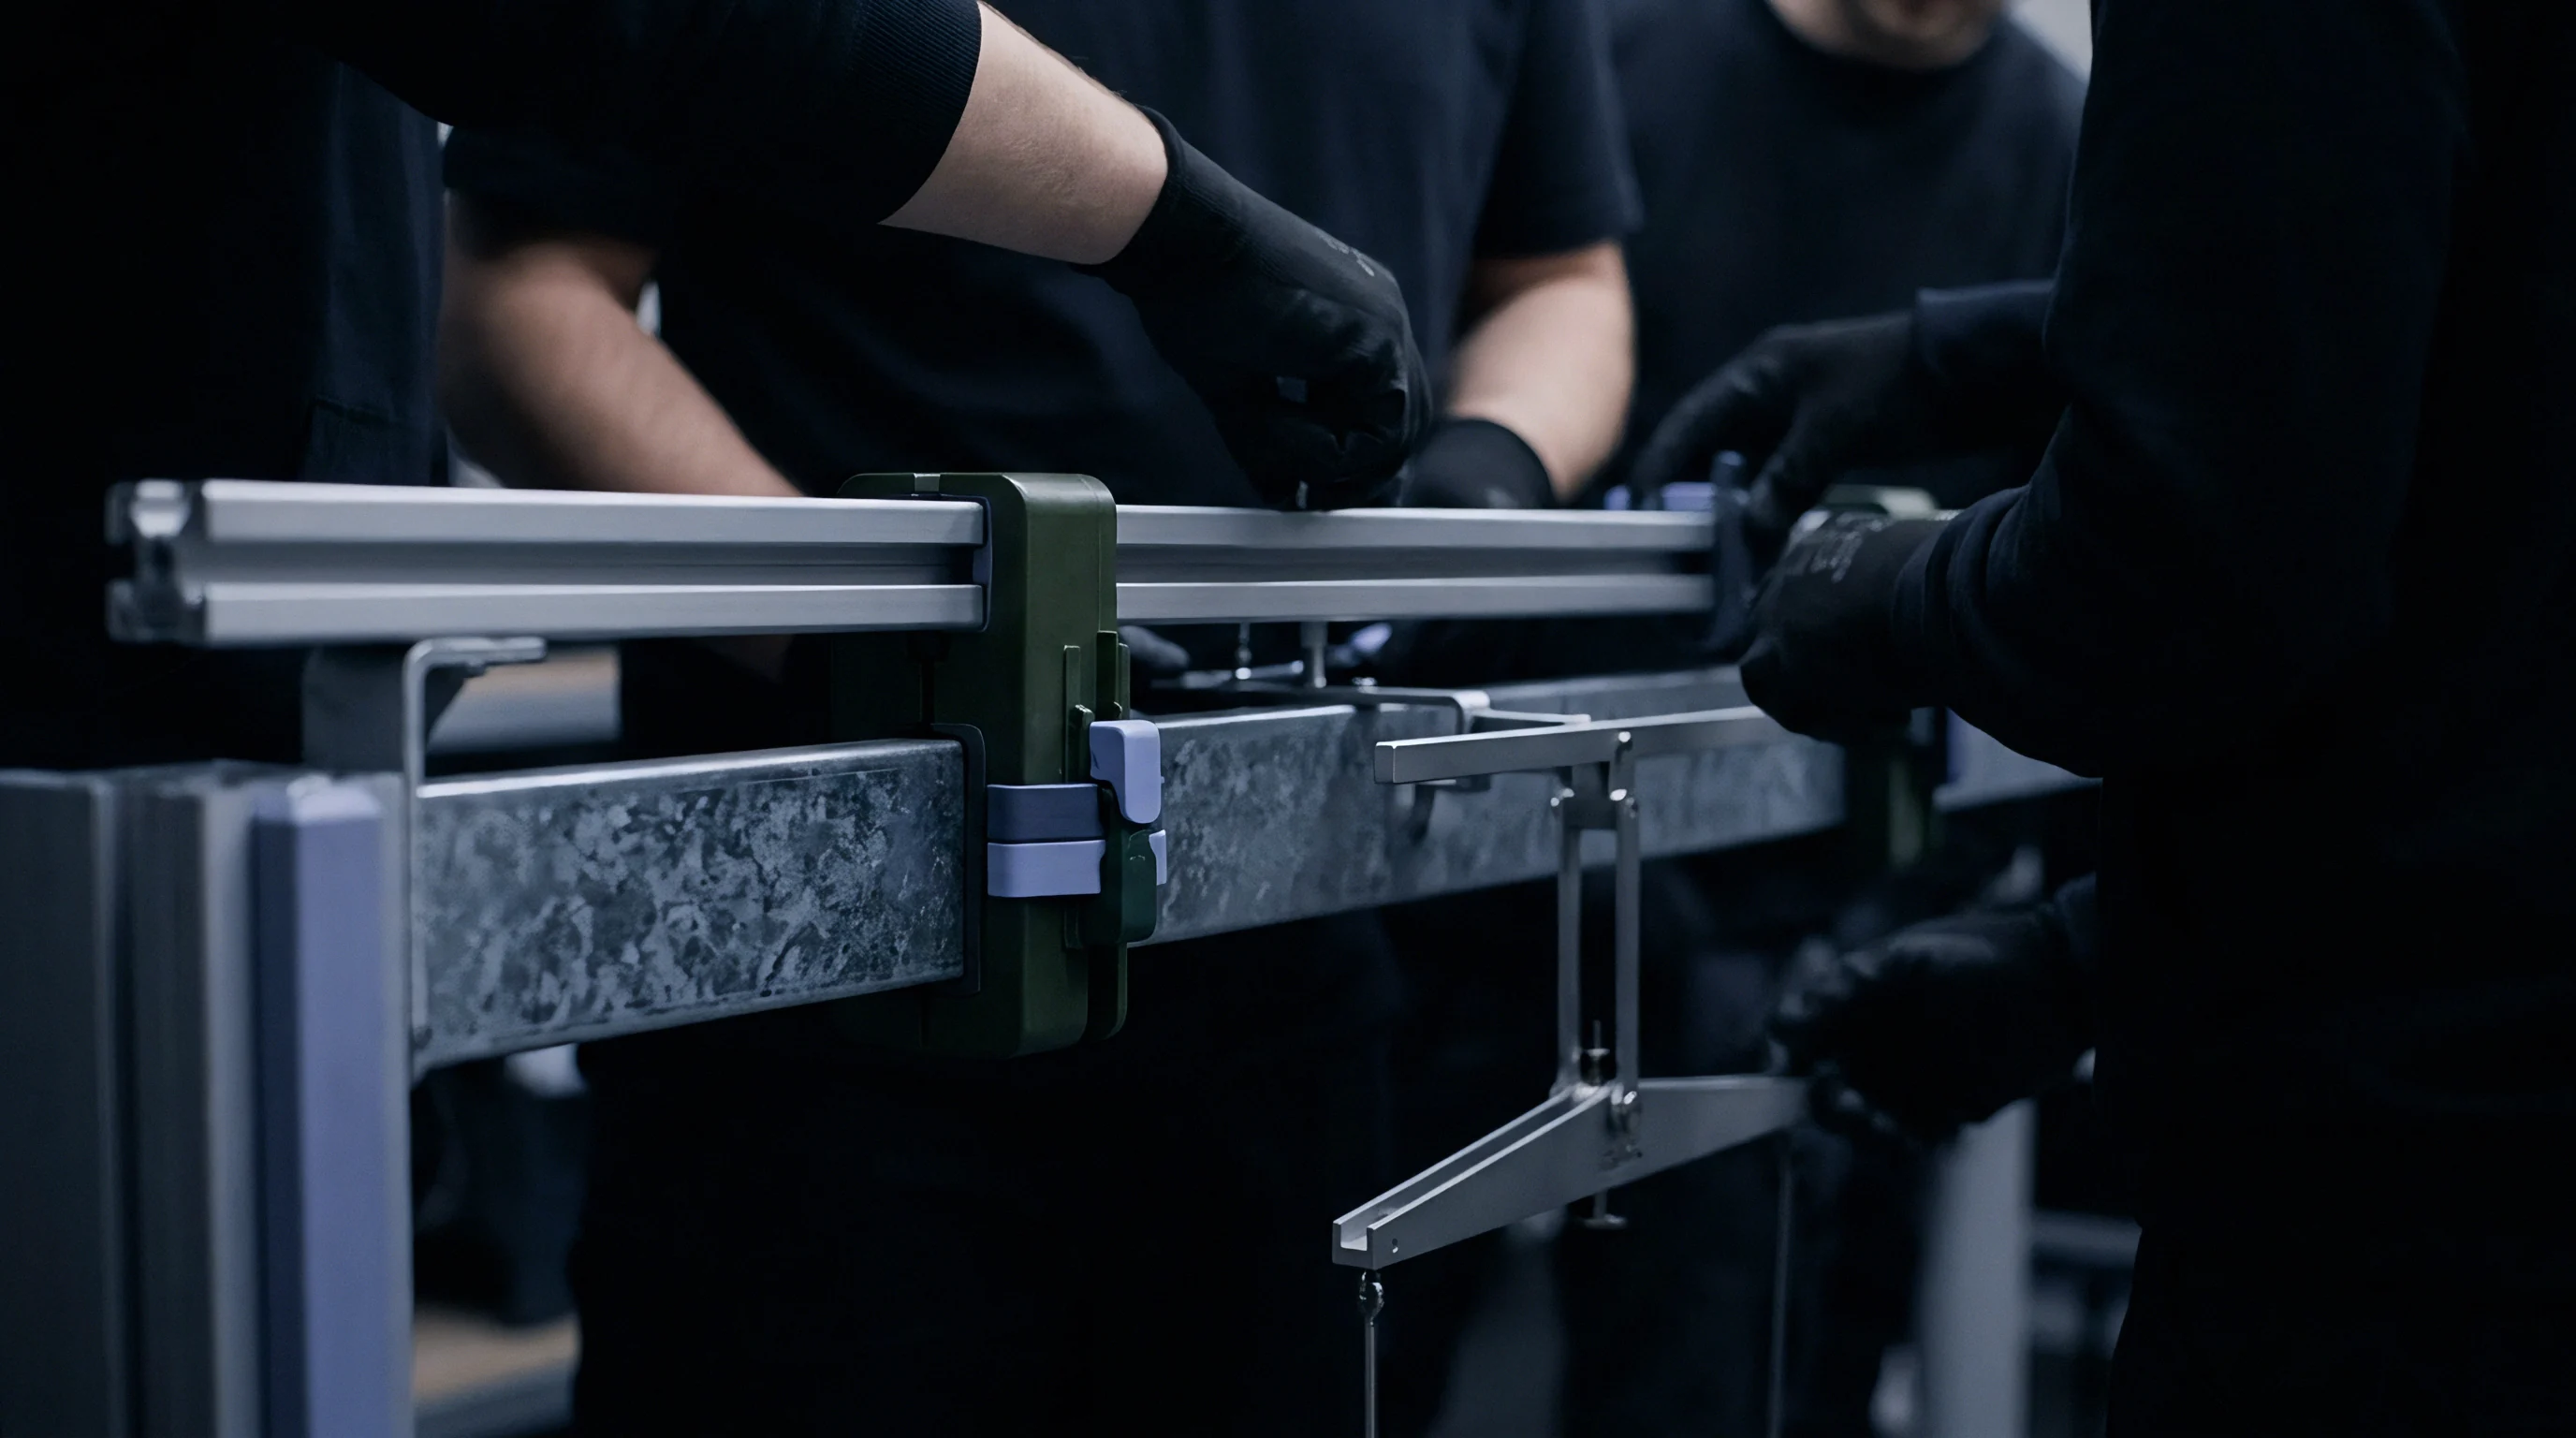
Over-constraining polymer inserts during setup introduces parasitic bending moments that warp cavity geometry. Uneven bolt torque on a polyurethane flange compresses local material, propagating stress through the block and distorting nearby sealing surfaces. Inspection fixtures should employ kinematic principles, using 3-2-1 positioning to locate the insert without inducing twist or binding during measurement.

Datum Alignment and Restrained Setup Mechanics
Unconstrained polymer parts sag under gravity, generating false out-of-roundness data in CMM reports. Establishing a reliable datum reference frame requires support surfaces that isolate the insert from self-weight deflection. Kinematic fixtures use spherical contacts mating with precision V-grooves or flat pads, touching the insert at defined points without surface binding.
Exact-constraint principles protect inserts from fixture-induced bending during scanning. When restrained-state inspection is specified, fixtures should incorporate torque-limiting clamps set to production specifications. Over-tightening clamps induces internal stress in low-modulus polymers, shifting cavity profiles and invalidating inspection results.
- Clean all reference datums and locator pins with isopropyl alcohol in a Class 7 cleanroom environment.
- Place the polymer insert onto three spherical contact points to set the primary orientation plane without introducing stress.
- Apply 1.2 Newton-meters of calibrated torque to the primary clamps while watching dial indicators for frame movement.
- Confirm secondary and tertiary alignment pins seat smoothly without binding against compliant surfaces.
- Record baseline datum coordinates with a non-contact optical sensor before starting full surface scanning.
Evaluating mechanical restraint during polymer tool qualification demonstrates its impact on dimensional data. A four-hundred-fifty-millimeter polyetherketoneketone (PEKK) composite mold core designed for aerospace structural fairings sagged into a saddle shape when unconstrained on an optical scan table, exhibiting zero point three two millimeters of diagonal deflection due to low flexural modulus and asymmetric laminate layups.
Initial free-state scans flagged the insert as non-compliant, pointing toward costly rework. Mounting the core in a kinematic inspection rig using pneumatic clamps calibrated to apply seventy Newton-meters of equivalent torque against steel reference receiver blocks reduced diagonal deviation to zero point zero four millimeters ~ well within engineering specifications.
Switching from rigid table clamping to kinematic seating yields a forty-two percent reduction in cavity dimensional variance.
Designing fixtures for flexible tooling involves balancing rigidity against optical access. Heavy aluminum fixtures prevent clamping distortion but often block sensor sight lines into tight radii or side-slide interfaces. Open-frame carbon-fiber structures offer high stiffness while maintaining clear optical access, permitting complete surface coverage during automated photogrammetry and blue-light scanning.
An unconstrained cavity insert that passed CMM inspection bound up the side slide during mold tryout, causing sixteen thousand dollars in lost machining hours.
Uncertainty
Calculating error budgets for polymer tooling requires separating environmental noise, machine drift, and material thermal expansion. Standard metrology frameworks often rely on static uncertainty assumptions tailored for steel, underestimating total uncertainty on flexible, heat-sensitive polymer substrates. ISO/IEC Guide 98-3 (the GUM) provides the methodology to combine sensor systematic errors and material variances into a defensible uncertainty budget.
Determining expanded uncertainty requires separating Type A statistical evaluations from Type B components. Type A components derive from repeated measurement runs under controlled conditions, capturing short-term repeatability and noise. Type B components draw from calibration certificates, optical resolution specifications, developer spray thickness variations, and material expansion uncertainty bands.
Temperature gradients across large polymer mold inserts create non-linear thermal bowing that simple linear expansion formulas cannot correct.
Because thermal drift shifts scanner calibration and noise masks tool wear, guardbands are necessary to protect downstream assembly fit and ensure uncertainty budgets accurately dictate pass rates.
Uncertainty calculations must account for sensor-material interactions. Variations in surface durometer across a block cause unequal stylus penetration on contact CMMs, introducing spatial bias. In optical scanning, ambient humidity shifts light absorption in hygroscopic resins, altering point cloud generation enough to expand the uncertainty envelope.

Statistical Error Decomposition in Polymer Inspection
Variance component analysis isolates measurement error caused by sensor repeatability from variations induced by part flexibility. Combined standard uncertainty is calculated by taking the square root of the sum of squared standard uncertainties weighted by their sensitivity coefficients. When inspecting polymers with high expansion coefficients, lab temperature fluctuations typically dominate the uncertainty budget, far exceeding the machine’s optical resolution limits.
Applying ISO 14253-1 decision rules governs whether a tool conforms to engineering specifications. The standard requires subtracting expanded uncertainty from the upper specification limit and adding it to the lower limit, creating a guardbanded acceptance zone. If measurement uncertainty consumes thirty percent of the print tolerance band, the usable manufacturing window shrinks by sixty percent ~ making sign-off difficult without rigorous environmental controls.

How Does Environmental Thermal Drift Bias Scanning Results?
Ambient temperature shifts affect both CMM scales and high-expansion polymer blocks during multi-hour scan routines. A drift of zero point five degrees Celsius over a two-hour optical run causes progressive expansion in polyurethane board that software can misinterpret as draft angle errors or surface warping. Compensation algorithms can only correct for thermal growth if sensors actively log scale and core temperatures throughout the scan.
- Temperature Differential Mapping confirms thermal sensors throughout the workspace remain within ±0.2 °C during full scanning runs.
- Target Displacement Screening monitors adhesive photogrammetry markers against hard datums to spot surface creep during long scans.
- Sensor Calibration Verification checks optical sensor measurements on certified sphere artifacts before each inspection shift.
- Datum Repeatability Screening requires five consecutive fixture loading cycles with no positioning variance over five micrometers.
Running Gauge Repeatability and Reproducibility (GR&R) studies on polymer tooling requires deliberate trial sequencing. Standard GR&R routines that repeatedly unclamp and remount parts risk wearing down soft datums, generating false reproducibility errors caused by pin hole degradation rather than sensor instability. Non-destructive GR&R protocols utilize kinematic quick-change interfaces to protect reference features across loading cycles.
When measurement uncertainty consumes more than a third of the print tolerance, the system measures environment variations rather than tool geometry.

Acceptance
Tooling sign-off requires proof that cavity dimensions remain stable through thermal cycling. Polymer tools used in short-run injection molding, resin transfer molding (RTM), or autoclave curing undergo degradation from heat and clamping force. Formal acceptance gates require comparing post-machining scans against post-tryout verification files to track wear, thermal creep, and surface compaction.
First Article Inspection Reports (FAIR) under aerospace AS9102 or automotive ISO 9001 standards confirm that critical dimensions match nominal CAD models within tolerance. For polymer tooling, however, passing an initial FAIR does not ensure long-term stability. Continued matrix cross-linking during initial thermal cycles can cause slight shrinkage or embrittlement, altering cavity geometry after fifty to one hundred molding cycles.
Because tool wear directly distorts molded components, full qualification depends on comprehensive metrology data and formal sign-off gates to protect production runs from thermal creep.
Qualification packages ought to include post-tryout drift analysis to establish baseline degradation rates. Rescanning the insert following initial mold trials reveals matrix compaction around high-pressure injection gates, parting lines, and mechanical slide shut-offs. Quantifying early material creep allows engineers to pre-compensate CAD models before committing to final machining.
Dimensional Dossier Verification and Sign-Off Gates
Quality engineers approve tool transfer packages when point-cloud comparisons align with nominal CAD models within tolerance. Color-coded 3D deviation maps derived from optical scans illustrate surface compliance across complex contours: green regions show geometry within tolerance, while red and blue areas mark high spots or over-cut regions requiring benching or rework.
Acceptance protocols rely on volumetric surface metrics rather than isolated point checks to establish pass-fail criteria. An insert might show ninety-eight percent of its surface within tolerance yet fail sign-off if the non-compliant two percent sits on a critical shut-off land or primary datum. Sign-off dossiers must include logged sensor calibration dates, ambient temperature histories, technician sign-offs, and raw point clouds stored in unedited neutral formats.
| Qualification Stage Gate | Mandatory Metrology Document | Acceptance Criteria Threshold | Governing Inspection Standard | Risk Allocation Sign-Off |
|---|---|---|---|---|
| Gate 1: As-Machined Base Geometry | Restrained Free-State Scan Comparison | 100% CAD Surface Match within ±0.05 mm | ISO 1101 / ISO 10579 | Tooling Fabricator Sign-Off |
| Gate 2: Thermal Stability Verification | Core Soak Logging & Expansion Map | Core Rate of Change < 0.1 °C / Hour | ISO 1 Environmental Standard | Metrology Lab Director Sign-Off |
| Gate 3: Post-Tryout Creep Evaluation | Pre vs Post Tryout Point Cloud Overlay | Parting Line Compaction < 0.02 mm | AS9102 FAIR Guidelines | Manufacturing Operations Sign-Off |
| Gate 4: Final Production Release | Complete Guardbanded FAIR Dossier | CPK > 1.67 on Critical Cavity Features | ISO 14253-1 Decision Rules | Quality Assurance Executive Sign-Off |
Missing temperature logs routinely invalidate months of wear data across qualification records. Maintaining measurement traceability requires tying metrology deliverables directly to commercial milestone payments. Contracts should stipulate that final vendor payments depend on complete metrology packages ~ including raw target coordinates, temperature logs, and measurement uncertainty budgets.
Post-qualification monitoring tracks dimensional drift as polymer tools age in service. Composite and polyurethane boards experience cumulative fatigue from repeated clamping and autoclave pressure cycles. Periodically rescanning the insert against its baseline Gate 1 reference file establishes a predictive wear curve, helping managers schedule recutting or replacement before non-conforming parts reach assembly.
Tooling procurement teams should hold final milestone payments until full thermal soak reports accompany coordinate scan files.
Whether real-time mold temperature monitoring can accurately predict post-ejection shrinkage without offline coordinate re-qualification remains an open question for high-volume automated cells.