Resolving Inter-Laboratory Metrology Discrepancies in Translucent Polymeric Micro Feature Verification for Medical Assemblies
Resolving translucent polymer micro-feature verification discrepancies across labs requires material-matched optical artifacts, standardized blue-light edge detection, and ISO 14253-1 guard-banding.


Ray
Photons passing through translucent polymers diffuse across material boundaries, obscuring physical edges from optical vision sensors. In micro-molded medical assemblies, such as fluidic manifolds, needle insertion hubs, and bio-assay cassettes, feature dimensions often fall below 200 micrometers with tolerances constrained to less than 5 micrometers. Standard vision systems rely on sharp grayscale gradient transitions to locate boundaries.
When light hits materials like cyclic olefin copolymer, polymethyl methacrylate, or translucent silicone elastomer, internal scattering creates a fuzzy illumination halo rather than a distinct step change in pixel intensity.
Optical penetration depth alters the apparent position of a boundary based on lighting orientation and material thickness. Surface illumination reflects directly off the upper plane, but light also penetrates several tens of micrometers into the substrate, scattering back out near edges. Photons diffuse inside the boundary.
This backscatter raises background pixel values outside the geometric boundary, systematically shifting the measured edge position inward or outward depending on whether darkfield or brightfield mode is active. Edge pixels shift inward. An automated edge-detection threshold set to fifty percent intensity misinterprets diffuse backscatter as true geometry, introducing systematic dimensional errors between three and nine micrometers across different measurement sites.

Subsurface Light Transmission Mechanics
When electromagnetic energy strikes clear resin micro-structures, the boundary acts as both a refractive interface and a scattering volumetric medium. Refraction skews the camera plane. The refractive index of medical polymers varies significantly across visible wavelengths, ranging from 1.49 in polymethyl methacrylate to 1.53 in cyclic olefin polymer.
Standard optical coordinate measuring machines using broadband white light sources suffer from chromatic dispersion. Blue wavelengths scatter more intensely than red wavelengths within translucent micro-walls, causing focus variations across the camera field of view.
Internal wall reflections in high-aspect-ratio micro-channels compound optical distortion. When measuring a channel fifty micrometers wide and one hundred fifty micrometers deep, illumination directed straight down reflects off channel side-walls at grazing angles. Reflected rays construct secondary intensity peaks adjacent to the physical floor-wall junction.
Automated edge tools interpret these secondary peaks as physical step changes, leading quality control technicians to report channels narrower than actual physical mold dimensions. Light scatters across thin walls.
Coaxial LED illumination at 470 nanometers reduces optical penetration depth in cyclic olefin polymer to under four micrometers, suppressing subsurface scatter relative to 630 nanometer red light.

Wavelength Selection and Edge Detection Shift
Illumination spectrum determines the depth to which photons penetrate aromatic and aliphatic polymer matrices before scattering back toward the detector lens. Shorter wavelengths experience higher bulk absorption and narrower scattering angles, confining backscatter closer to the point of entry. Transitioning from diffuse red backlight sources to narrow-band blue ring lights narrows the grayscale transition zone at part boundaries from fourteen pixels down to three pixels on a standard five-megapixel machine vision sensor.
Edge detection algorithms compound errors when thresholds remain fixed across different optical instruments. Max-gradient mathematical operators identify the steepest slope in pixel grayscale values, but subsurface reflection flattens this gradient curve. An optical machine equipped with low numerical aperture optics spreads the transition across more camera pixels than a high numerical aperture system.
Consequently, two laboratories analyzing the exact same translucent micro-feature with identical software settings report conflicting dimensions because the underlying image optical Transfer Function differs between hardware setups.
| Polymer Resin Grade | Refractive Index (nd) | Illumination Wavelength (nm) | Penetration Depth (µm) | Systematic Edge Bias (µm) |
|---|---|---|---|---|
| Cyclic Olefin Copolymer (TOPAS 5013L) | 1.533 | 630 (Red) | 12.4 | +4.8 |
| Cyclic Olefin Copolymer (TOPAS 5013L) | 1.533 | 470 (Blue) | 3.8 | +1.1 |
| Cyclic Olefin Polymer (Zeonex 690R) | 1.531 | 525 (Green) | 6.2 | +2.2 |
| Polymethyl Methacrylate (Plexiglas 7N) | 1.491 | 630 (Red) | 18.1 | +6.3 |
| Translucent Medical Silicone (40 Shore A) | 1.412 | 470 (Blue) | 22.5 | +8.7 |
Failure modes in optical micro-metrology originate from misaligned physical assumptions regarding light-material interactions.
- Subsurface Photon Scattering occurs when incoming light penetrates the polymer matrix and re-emerges near boundary edges, elevating baseline intensity values and corrupting edge derivative calculations.
- Internal Total Reflection traps light within high-aspect-ratio micro-walls, casting false high-intensity lines on vision sensors near internal fillets.
- Chromatic Focus Shift distorts boundary location when non-achromatic lenses image broad-spectrum light passing through dispersively varying polymer channels.
- Grayscale Threshold Drift shifts measured dimensions when two laboratories apply identical intensity percentage cutoffs to image profiles carrying different signal-to-noise ratios.
Ignoring light scattering dynamics during optical inspection design causes false batch rejections, setting off unnecessary tool modifications that ruin working multi-cavity injection molds.


Probe
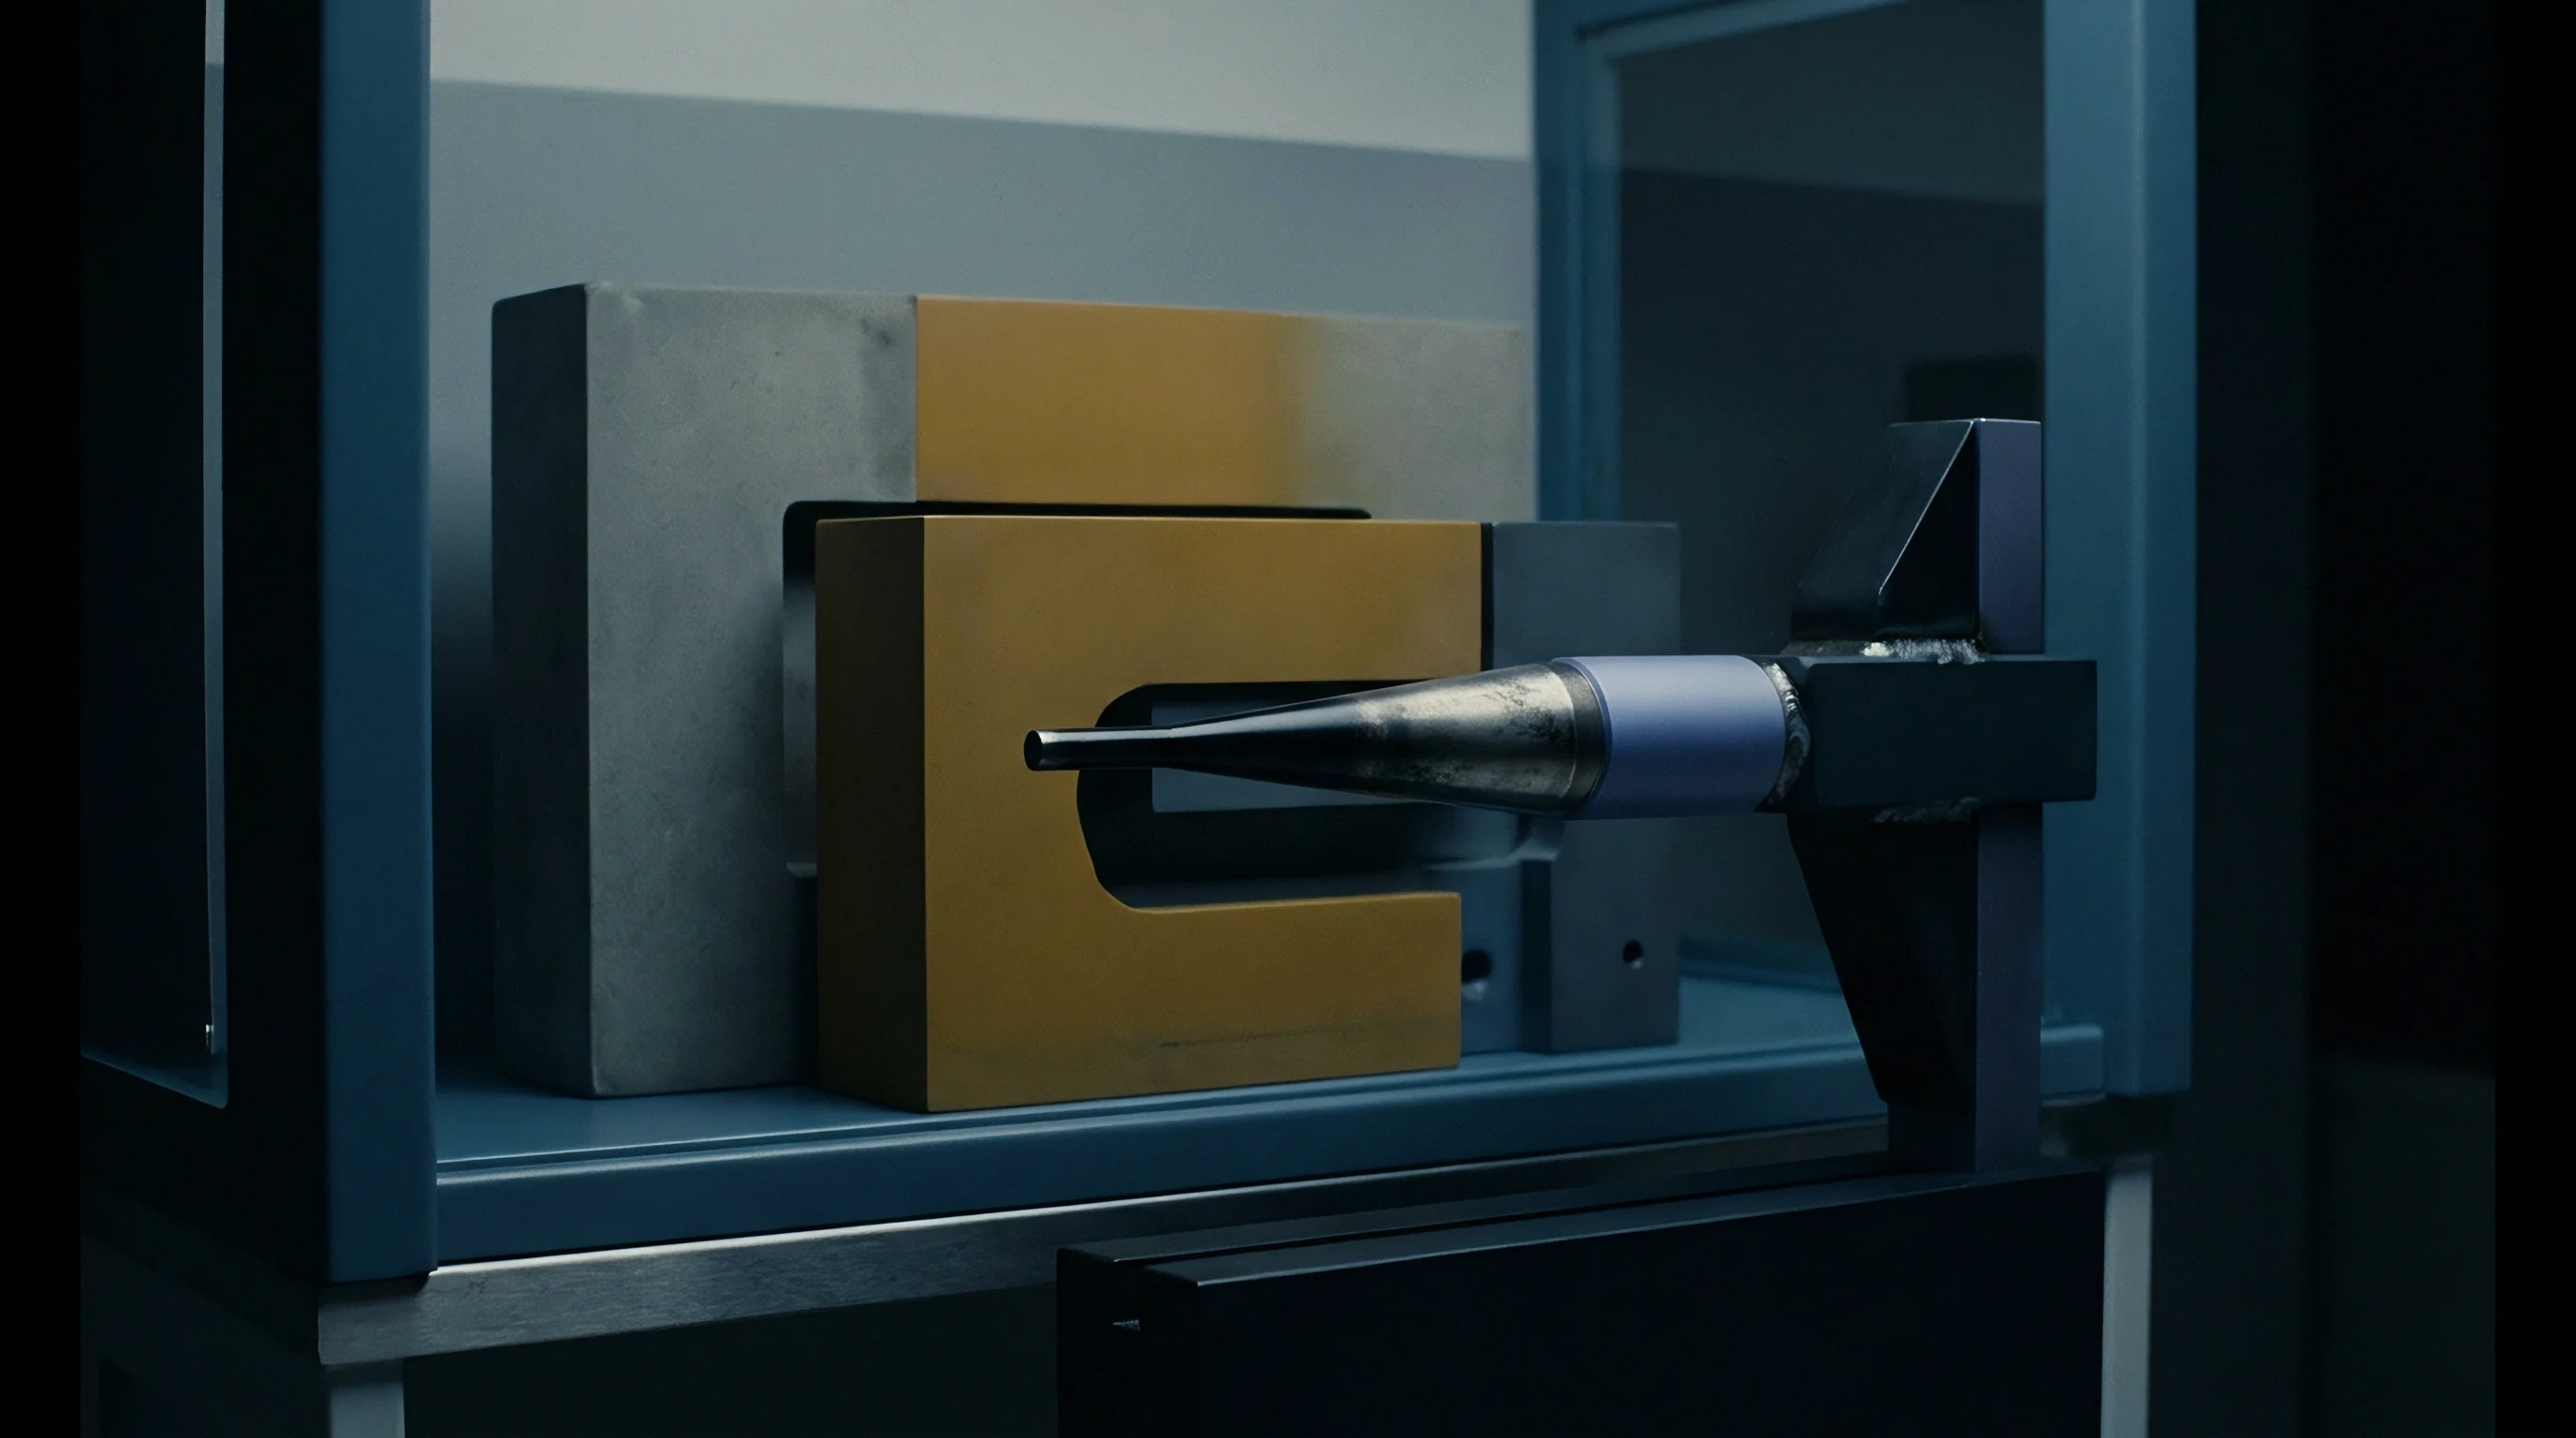
Physical contact with compliant polymer micro-walls introduces local mechanical deformation that shifts dimension readings below true geometry. Tactile coordinate measuring machines and micro-stylus profilometers apply contact forces ranging from a few millinewtons down to tens of kilonewtons. On thin-walled medical polymers, even a force of one hundred kilonewtons compresses elastic micro-features, causing the stylus tip to sink into the surface during data collection.
Force bends the polymer wall. Tactile styli deflect elastic resins.
Stylus tip radius convolution presents an unavoidable geometric filter when measuring narrow internal channels and micro-radii. A ruby or diamond tip with a radius of twenty micrometers cannot reach the floor of a micro-fluidic trench that narrows to fifteen micrometers. The instrument records a shallow, rounded bottom profile, leading inspectors to conclude that the part suffered from short-shot molding defects.
Combining small tip radii with low contact force introduces stylus flexure, where the long slender shank deforms sideways along inclined micro-walls, distorting horizontal coordinate registration.

Tactile Micro Stylus Force Dynamics
Displacement measurements recorded via ruby or diamond tips depend on applied normal loading and the localized flexural modulus of the polymer. Under Hertzian contact stress equations, a spherical stylus tip pressing against a flat polymer plane produces localized elastic indentation depth proportional to the contact force to the power of two-thirds, and inversely proportional to the flexural modulus. For soft medical grade thermoplastics with a flexural modulus near two gigapascals, a two-millinewton contact force from a one-hundred-micrometer radius tip generates an elastic indentation exceeding one micrometer.
That single micrometer consumes twenty percent of a five-micrometer total tolerance band.
Contact speed further alters measured values due to viscoelastic material creep. Medical polymers exhibit time-dependent deformation. A slow-moving tactile stylus dwell lingering on a micro-wall registers progressive creep, continually expanding the measured dimension until the probe lifts.
Fast scanning modes introduce dynamic bounce, causing the stylus tip to momentarily lose contact with micro-undulations, under-reporting surface roughness and wall variation peaks.
Contact probing on compliant micro-structures compresses target walls unless normal forces remain strictly below twenty kilonewtons.

Multi Sensor Metrology Evaluation
Combining optical profile acquisition with tactile touch points demands clear rules for sensor fusion and spatial coordinate registration. Non-contact sensors, such as chromatic confocal point sensors and focus variation optics, eliminate mechanical surface indentation. Chromatic confocal sensors measure distance by analyzing the wavelength of light returned through a hyper-chromatic lens setup.
However, when applied to translucent resins, a portion of the chromatic beam reflects off the top surface while another portion reflects from subsurface material transitions, causing multi-peak signal confusion.
Micro computed tomography offers full three-dimensional non-destructive evaluation of internal micro-cavities, but faces attenuation limits in low-density polymers. X-ray absorption in medical plastics is low, requiring long acquisition times and high-resolution voxel reconstruction to achieve spatial resolutions below two micrometers. Polymer density variations, thermal expansion during prolonged x-ray exposure, and voxel thresholding errors at boundary surfaces introduce dimensional variations between micro computed tomography scans and optical coordinate measurements.
| Metrology Modality | Stylus / Beam Force | Spatial Resolution (µm) | Gauge R&R (% of 5µm Tol) | Primary Artefact Mechanism |
|---|---|---|---|---|
| Tactile Micro-Stylus CMM | 150 µN | 0.5 | 28.4 | Surface indentation and wall flexure |
| Low-Force Micro-Contact Probe | 15 µN | 0.2 | 12.1 | Stylus shank deflection on steep walls |
| Chromatic Confocal Sensor | Zero (Optical) | 0.1 | 18.7 | Subsurface reflection peak blending |
| Focus Variation Optical CMM | Zero (Optical) | 0.8 | 22.3 | Contrast loss on smooth clear resin |
| Micro Computed Tomography | Zero (X-Ray) | 1.5 | 15.2 | Voxel threshold shift and thermal drift |
Quality engineers at contract injection molders frequently complain that customer labs push touch probes into delicate plastic ribs until the flexural yielding matches their biased optical numbers.
Refusal
Discrepancies between manufacturing site inspection dockets and receiving quality audits frequently trigger immediate lot holds. Refusal halts line validation. Discrepancy breeds contract litigation.
When Laboratory A at a supplier site certifies a batch of micro-molded fluidic chips as compliant, and Laboratory B at the medical device assembler rejects the same shipment upon arrival, the root cause usually resides within uncalibrated environmental controls or mismatched measurement protocols rather than actual part molding variance.
Temperature variation acts as a hidden driver of dimensional divergence across lab boundaries. Medical polymers exhibit high coefficients of thermal expansion, typically ranging between sixty and ninety parts per million per degree Celsius. A translucent micro-feature measuring two hundred micrometers at twenty degrees Celsius expands by nearly 0.15 micrometers for every single degree increase in ambient room temperature.
If Laboratory A operates at a controlled twenty degrees Celsius while Laboratory B operates its optical metrology equipment at an uncalibrated twenty-three degrees Celsius ambient plant temperature, thermal expansion alone accounts for nearly half a micrometer of discrepancy across a short feature, and several micrometers across a larger array.

Can Cross-Site Optical CMM Discrepancies Be Isolated without Destructive Testing?
Non-destructive verification requires parallel verification protocols using identical ambient temperature, part clamping force, and pixel intensity thresholding across both facilities. Isolate hardware variance from software algorithm discrepancies by exchanging digitized raw sensor files before re-machining tooling. Transferring raw camera image files or raw chromatic confocal point cloud data allows metrology engineers to evaluate whether measurement divergence stems from physical image capture differences or post-processing line-fitting calculations.
Standardizing mechanical part restraint prevents structural deformation during non-contact and contact scanning. Micro-molded assemblies possess low structural stiffness. Oversimplified mechanical clamping at inspection stations can bow translucent substrates, distorting micro-channel positions across the horizontal plane.
Utilizing custom vacuum fixtures with identical vacuum pressure settings across all test locations holds components flat without imposing localized compressive stress.

Inter Laboratory Measurement Variance Breakdown
Decomposing total gauge variance into distinct hardware, environment, and operator components isolates the physical driver of dimensional drift. Measurement system analysis executed across multiple facilities requires nested gauge reproducibility structures to prevent confounding part-to-part manufacturing variation with laboratory system errors.
- Stabilize environmental conditions across all testing facilities to twenty degrees Celsius plus or minus half a degree, maintaining relative humidity below fifty percent for at least four hours prior to measurement.
- Furnish both laboratories with identical vacuum holding fixtures designed to support thin-walled polymer sections without introducing mechanical distortion.
- Establish fixed light intensity profiles and specific numerical camera aperture settings to standardize optical edge definition across instruments.
- Program identical edge detection derivative filters and threshold percentages into vision software packages across both sites.
- Run a ten-part, three-operator, three-replicate nested measurement loop at both locations using the exact same physical sample set.
- Calculate variance components using analysis of variance techniques to isolate site-to-site reproducibility from localized repeatability errors.
What remains unexplained after eliminating thermal expansion, fixture bending, lighting spectrum, and threshold software setting variables is whether optical penetration depth varies between different polymer material lots due to subtle raw resin lot-to-lot colorant or clarity shifts?

Block
Calibration standards machined from glass or steel fail to mimic the specific photon attenuation and refraction index of translucent polymers. A chrome-on-glass grid standard provides perfect opaque edges with zero light penetration. Calibrating an optical vision system using a chrome-on-glass artifact establishes system magnification accurately, but fails to correct for the edge position shift that occurs when imaging semi-transparent medical plastics.
Dimensional errors remain hidden until production parts enter the measurement loop.
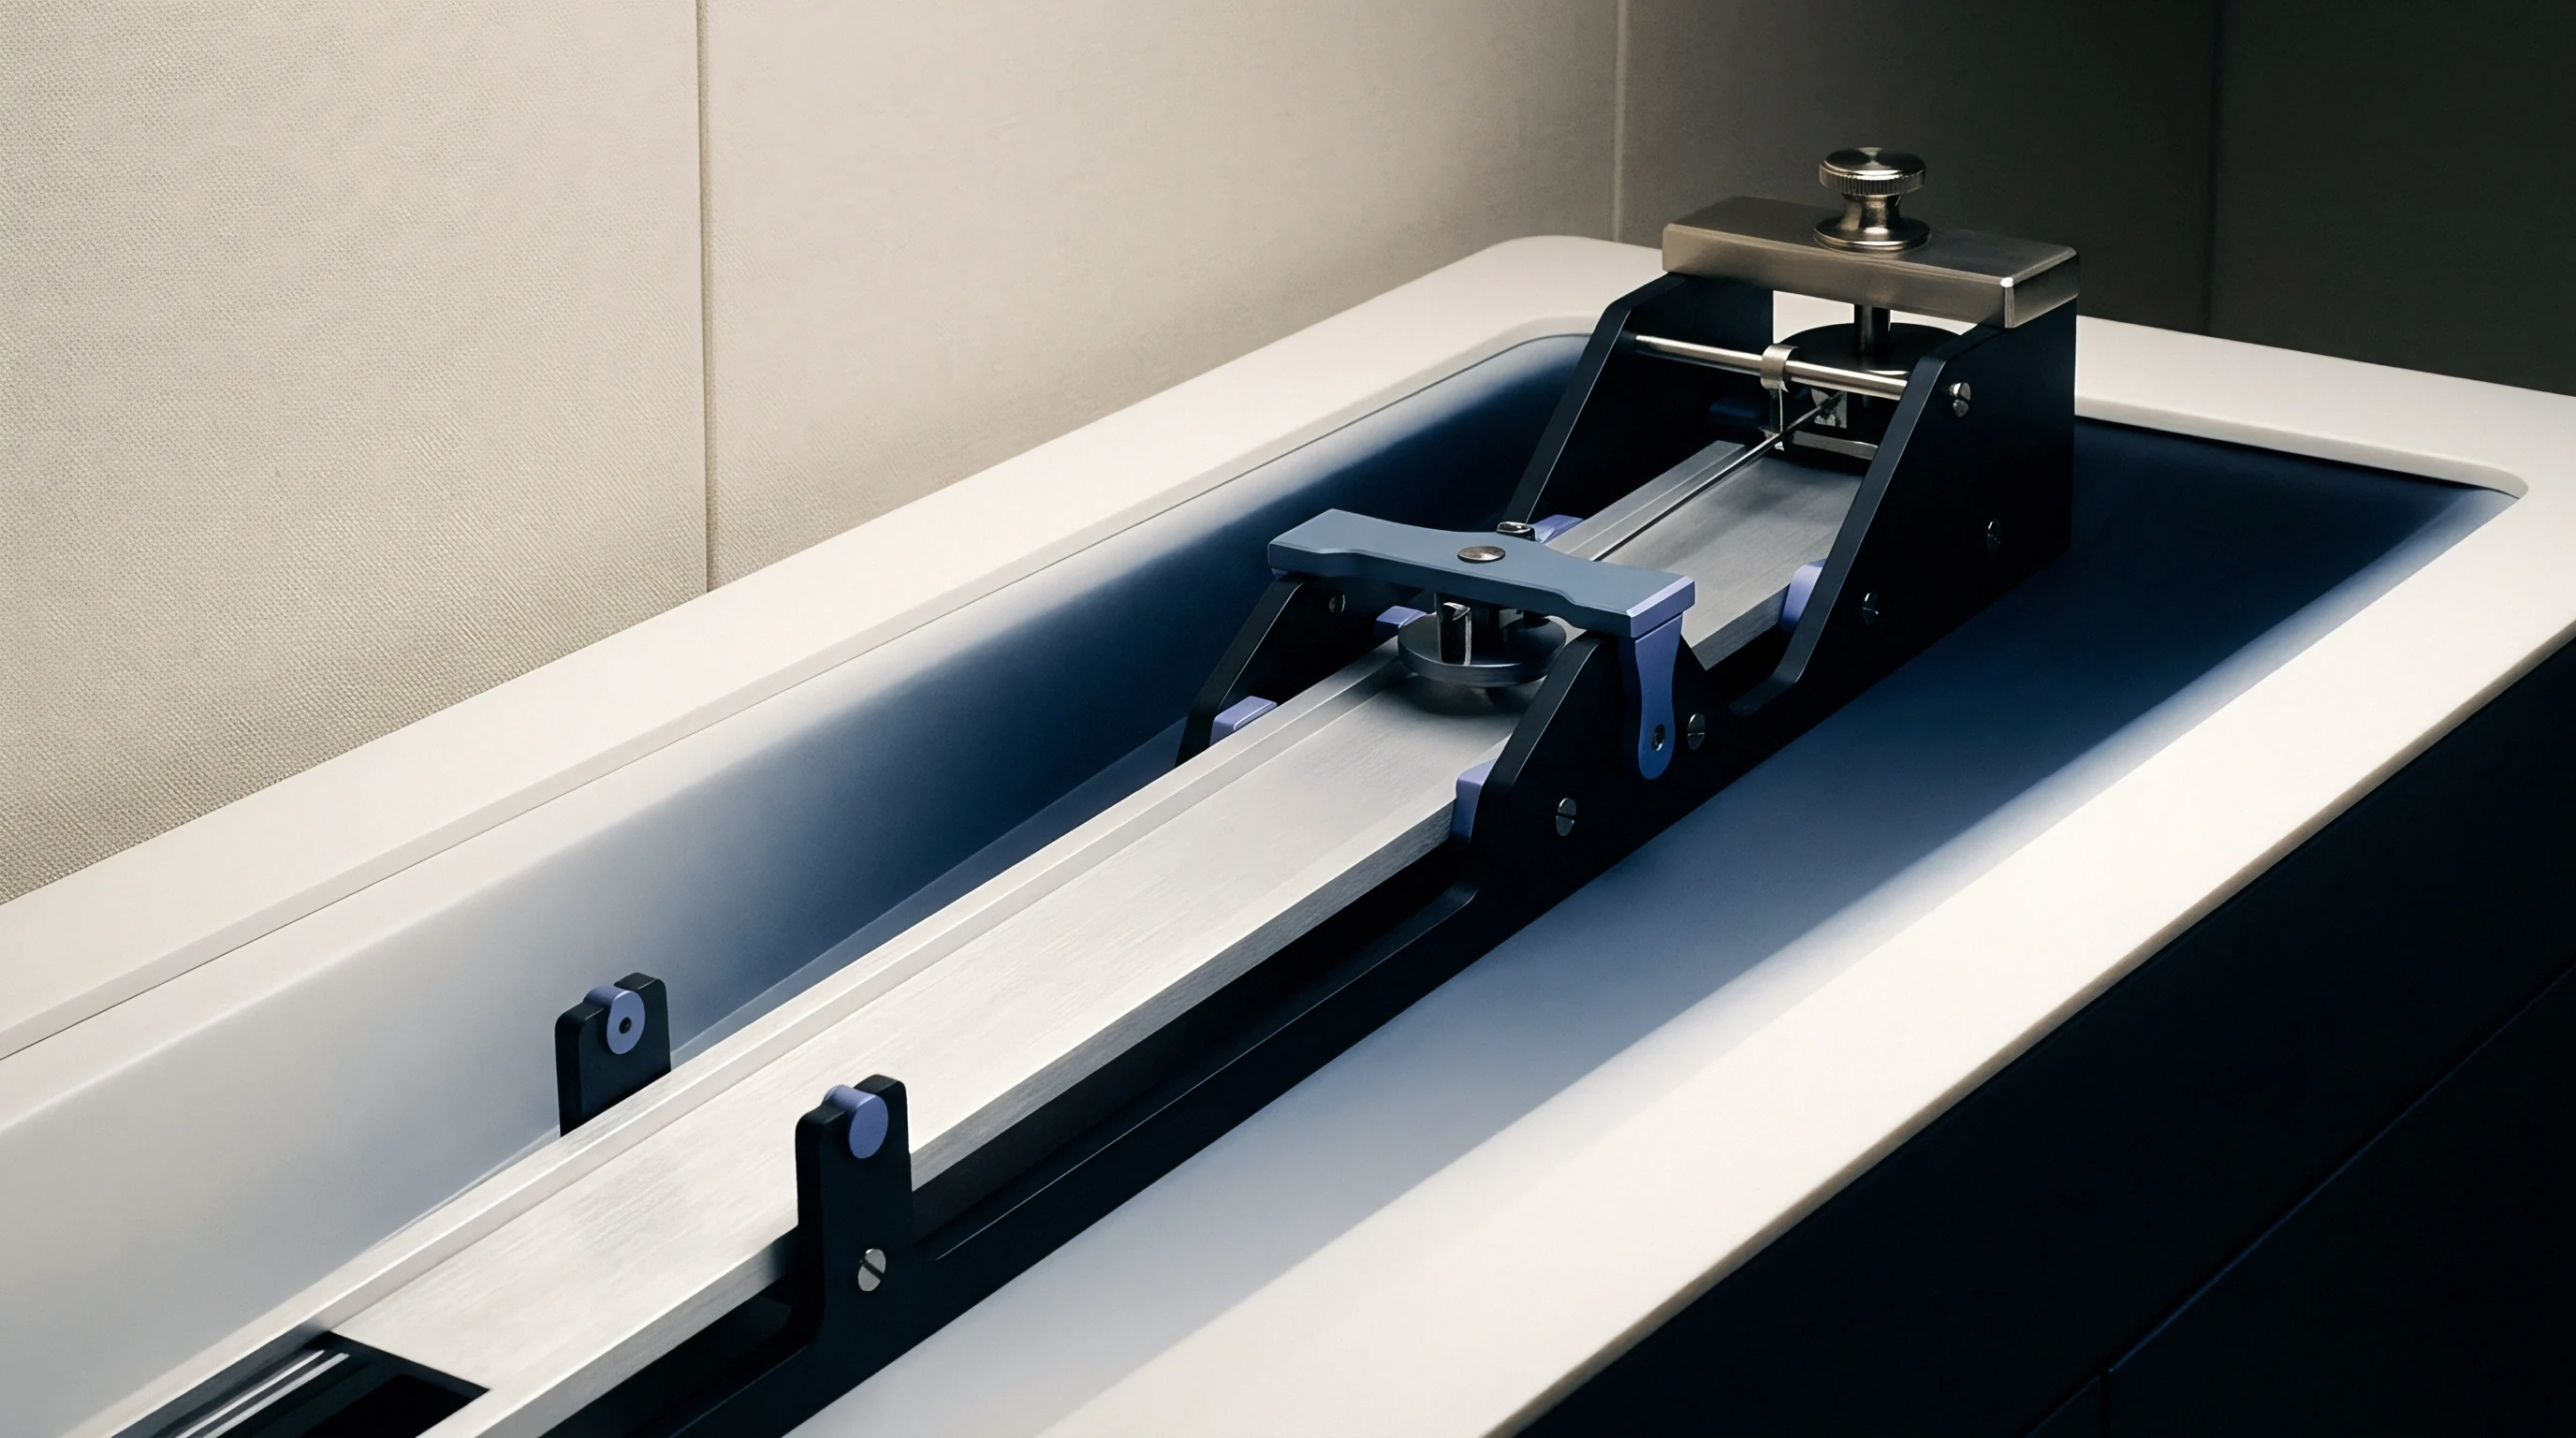
Physical reference artifacts crafted from identical polymer matrices correct for subsurface light scattering during optical setup. Machining micro-steps, pin arrays, and channel grooves directly into polished blocks of cyclic olefin polymer or polymethyl methacrylate yields transfer standards that replicate production part optics. When an optical machine images a polymer transfer artifact, light scatters through the substrate identically to a production component, allowing software offset tables to zero out refractive boundary shifts.

Material Matched Physical Artifacts
Diamond-turned reference components produced from identical polymer batches eliminate optical scattering discrepancies between transfer standards and production parts. Single-point diamond turning achieves surface roughness values below five nanometers on clear plastics, producing crisp micro-feature geometries without inducing subsurface micro-cracks that scatter light unpredictably. Calibration artifacts demand material matching.
Certifying polymer transfer blocks requires primary calibration on ultra-precision national metrology institute systems, such as atomic force microscopes or low-force contact profilometers traceable to international standards. Once certified, these polymer blocks travel between production sites and receiving facilities as reference master artifacts. Measuring the polymer artifact at both facilities generates a site-specific offset factor that cancels out local light source differences and optical transfer function variations.
System calibration per ISO 10360-7 using chrome-on-glass targets validates optical magnification but does not compensate for bulk material translucency bias.

Traceability and Calibration Chain Validation
Linking shop-floor measurement tools back to national metrology institutes requires step-by-step verification of optical depth bias and tip radius wear. Calibration chains for micro-scale dimensions break down when environmental or material factors remain unrecorded in calibration certificates. Measurement uncertainty calculations must include contributions from material translucency variations, temperature drifts, and sensor drift.
| Uncertainty Contributor | Standard Uncertainty (µm) | Probability Distribution | Sensitivity Coefficient | Uncertainty Contribution (µm) |
|---|---|---|---|---|
| Primary Master Certification (AFM Traceable) | 0.05 | Normal (k=2) | 1.0 | 0.025 |
| Thermal Expansion Variance (±0.5°C) | 0.035 | Rectangular | 1.0 | 0.020 |
| Material Refractive Index Variation (±0.002) | 0.120 | Rectangular | 0.8 | 0.055 |
| Optical Focus Repeatability | 0.080 | Normal (k=1) | 1.0 | 0.080 |
| Edge Threshold Selection Variance | 0.150 | Rectangular | 1.0 | 0.087 |
Material-matched physical reference blocks must be specified in the quality manual before validation starts.
- Resin Grade Matching ensures the calibration block optical refractive index matches production components within 0.001 units.
- Subsurface Roughness Control prevents diamond-tooling mark chatter from generating false backscatter noise inside calibration channels.
- Thermal Stabilization Dwell mandates placing reference blocks inside temperature-controlled metrology enclosures for two hours prior to master calibration loops.
- Traceable Contact Calibration verifies master block feature dimensions using atomic force or low-force micro-stylus systems independent of optical refraction effects.
Per ISO 17025 Section 7.8.2, calibration certificates that omit environmental temperature records and light source wavelength parameters during optical calibration render the entire measurement chain non-traceable for translucent medical device validation.
Accord
Contractual agreements between medical assembly vendors and brand owners live or die on unambiguous dimensional acceptance boundaries. Unaligned gauges cause scrap. Data drift halts volume expansion.
When manufacturing translucent polymeric micro-features, quality agreements that simply state dimensional tolerances without specifying metrology hardware, light wavelengths, lighting angles, software version levels, and edge threshold algorithms invite multi-million dollar delivery disputes.
Guard-banding micro-tolerances provides a clear mathematical path to prevent false acceptance and false rejection between trading partners. ISO 14253-1 establishes decision rules for proving conformity or non-conformity with specifications. Under these rules, the specification zone is reduced on each side by the expanded measurement uncertainty value calculated for the specific laboratory setup.
If Laboratory A carries a two-micrometer measurement uncertainty on a micro-channel feature, the acceptable manufacturing tolerance band contracts by two micrometers on each boundary, guaranteeing that any product passed by Laboratory A will pass receiving inspection at Laboratory B regardless of minor system variations.

Guard Banding Rules for Micro Feature Tolerances
Shrinking specification zones by the expanded measurement uncertainty ensures that every shipped micro-part remains fully compliant. However, guard-banding transfers the financial risk of measurement uncertainty directly to the molder. A wide measurement uncertainty band narrows the usable injection molding process window, forcing molders to reject good physical parts simply because the inspection tool cannot read the edge accurately.
Investing in higher-precision metrology systems, blue light illumination sources, and material-matched transfer standards shrinks the expanded measurement uncertainty. Shrinking the measurement uncertainty band restores the usable molding process window, increasing first-pass yield and eliminating shipping holds. Both parties profit when measurement variance drops below ten percent of total feature tolerance.
Quality agreements incorporating ISO 14253-1 guard-banding rules shift manufacturing focus from arguing over rejected lots to reducing instrument uncertainty.

Referee Laboratory Dispute Resolution Protocol
When primary vendor and customer facilities reach an impasse, an independent accredited metrology center conducts master evaluation using pre-agreed reference instruments. The choice of referee lab must occur during the commercial contract negotiation phase, not after a batch rejection has already disrupted the medical device supply chain. The contract identifies the designated referee laboratory, the exact multi-sensor coordinate measuring machine model, the lighting wavelengths, fixture vacuum levels, and the precise guard-banding formulas applied to settle discrepancies.
Inter-laboratory metrology alignment forms the underlying gate for medical manufacturing scale readiness. Scaling micro-molded assembly production across multiple manufacturing sites before establishing physical calibration traceability, light-scattering corrections, and standardized optical algorithms multiplies dimensional rejections and destroys commercial margins.