Apportioning Multitenant Slab Degradation Costs through Differential Settlement Metrology and Wheel Hardness Logs
Apportioning shared slab wear costs requires combining digital elevation profile surveys with tenant vehicle fleet wheel hardness logs and transit telemetry.
Spall
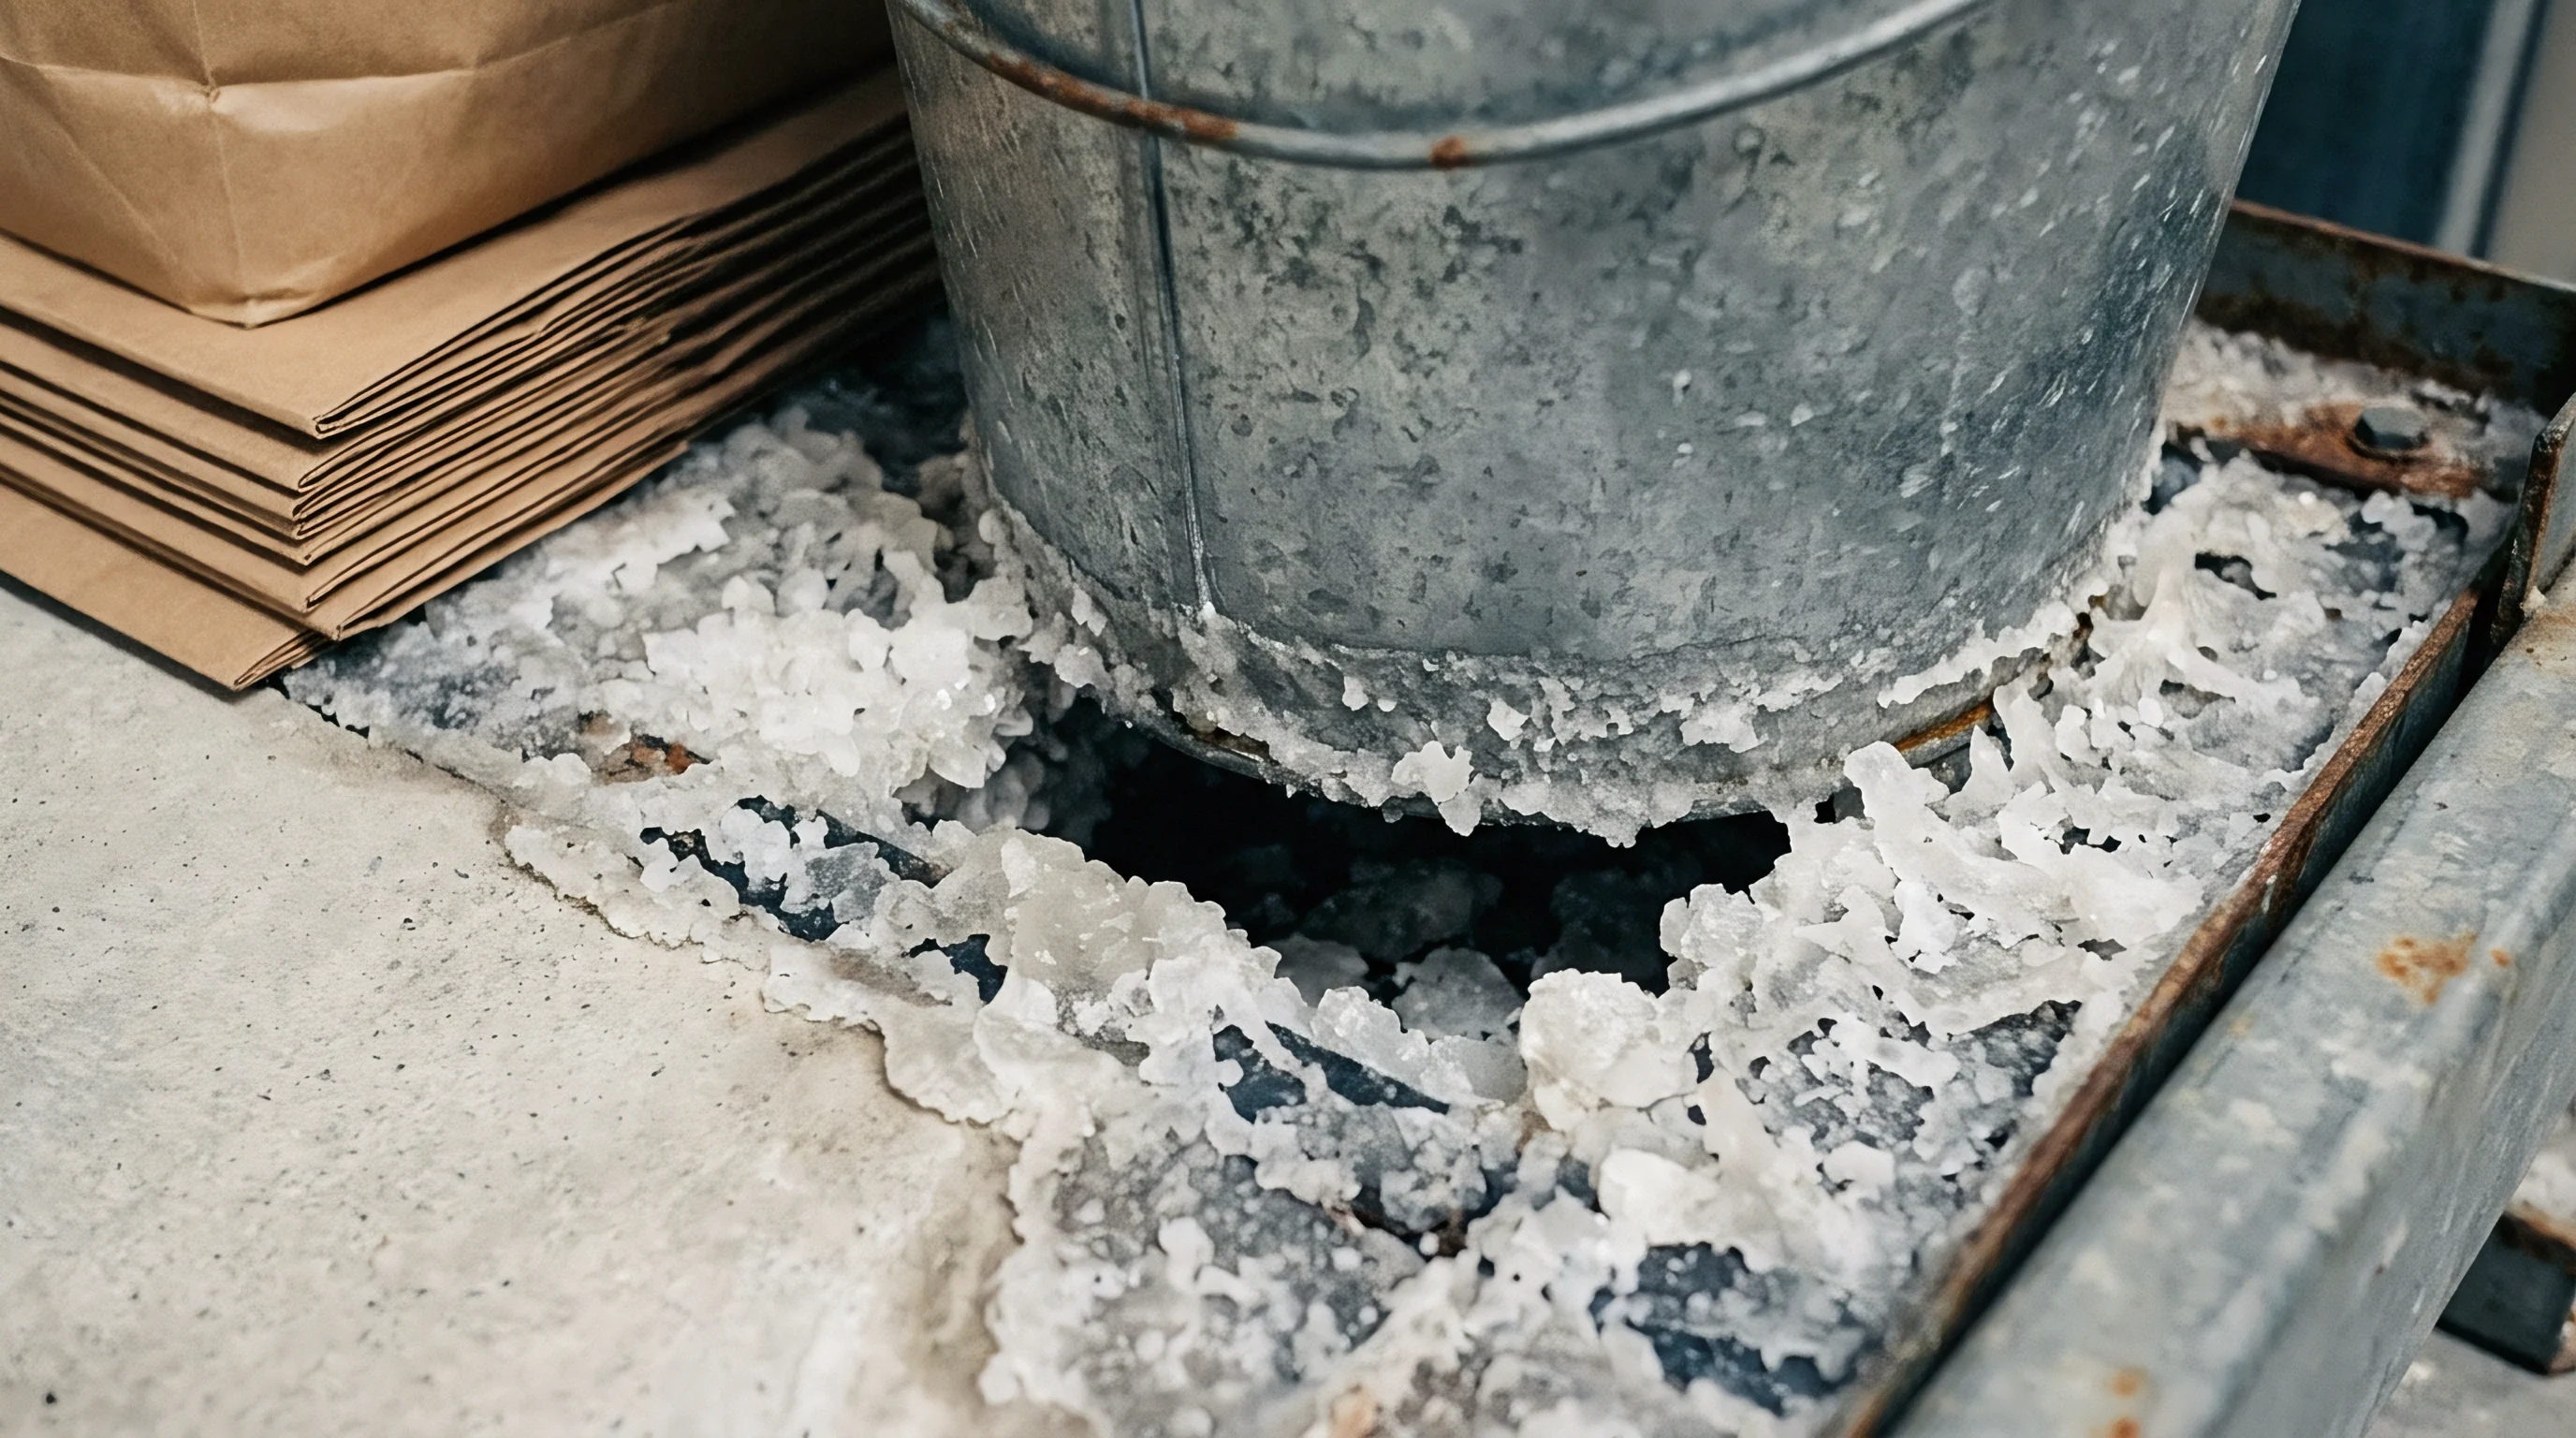
Point loads from narrow-aisle material handling equipment chew through industrial floor concrete long before subgrade voids trigger bulk structural collapse. When multiple logistics operators run three-shift cross-docking operations over a common jointed plain concrete floor, surface breakup starts at transverse contraction joints. Forklifts equipped with direct-bonded polyurethane, cast iron, or hard rubber tires generate localized contact pressures between 8 and 35 megapascals directly along saw-cut edges.
That localized mechanical pulverization operates alongside deep geotechnical movement.
Differential subgrade compaction produces localized slab curling and step discontinuities across construction joints. When an unreinforced slab settles unevenly by more than three millimeters across a panel joint, passing drive wheels cease rolling smoothly across an uninterrupted plane. The trailing edge takes an impact hammer blow from every loaded vehicle axle.
Joint spalling accelerates through aggregate interlock attrition, dowel loosening, and microscopic shear failure.
Under an eight-tonne axle load, an unarmored contraction joint carrying a four-millimeter vertical offset yields twenty times faster than a planar joint surface.
Separating environmental subgrade displacement from operational wheel abuse forms the primary technical dispute between warehouse landlords and industrial tenants. Subgrade movement remains the structural responsibility of the asset owner under standard commercial net lease agreements. Mechanical surface attrition from inappropriate wheel selection, overloaded mast trucks, and excessive operating velocities belongs entirely to tenant maintenance accounts.
Landlords routinely issue dilapidation notices attributing edge degradation to tenant operational velocity. Tenants push back, blaming poor dowel alignment, curling, and underlying subgrade failure for every cracked joint edge.
Evidence on file determines financial liability. Without baseline floor flatness records and running wheel hardness logs, forensic engineering defaults to crude visual assessments that fail commercial arbitration. Microscopic inspection of concrete core samples pulled from damaged joint margins reveals the root breakdown pattern.
Horizontal delamination microcracking 10 to 25 millimeters beneath the wear surface points directly to cyclic wheel impact fatigue. Sub-vertical shear fractures propagating downward from subbase voids confirm loss of ground support beneath the slab boundary.
Property owners who misidentify deep geotechnical settling as superficial traffic wear pay for repeated surface epoxy mortar patches that shear off within ninety days.

Profile
Accurate apportionment requires systematic differential settlement surveying across fixed bench markers tied to non-yielding structural columns. Optical leveling rods, continuous digital inclinometer floor profilers, and high-density terrestrial LiDAR scans establish the actual vertical elevation drift across individual slab panels over time. ASTM E1155 provides the standardized measurement framework for floor flatness and levelness numbers, yet standard F-number surveys fail to isolate joint curling from deep consolidation settlement.
How Surface Wear Distinguishes Abrasion from Flexure?
Curling represents a thermo-hygrometric deformation pattern where moisture loss from the slab surface causes top-fiber shrinkage relative to the wetter bottom zone. Differential settlement involves true geotechnical downward migration of the subbase under repeated dynamic loading. A walking profiler measuring longitudinal elevation profiles across panel joints records distinctive spatial geometry signatures for each mechanism.
| Defect Mechanism | Profile Waveform | Elevation Gradient | Primary Root Driver |
|---|---|---|---|
| Slab Corner Curling | Concave parabolic upward curve | 1.5 to 3.0 mm per meter | Differential slab curing shrinkage |
| Subgrade Consolidation | Monotonic downward planar tilt | 4.0 to 12.0 mm across bay | Poorly compacted fine subbase soil |
| Dowel Bar Loosening | Sharp vertical step discontinuity | 0.8 to 5.0 mm at seam | Mechanical cyclic impact load transfer |
| Mechanical Rutting | Localized channel depression | 2.0 to 8.0 mm wheel path | Ultra-hard wheel contact grinding |
Elevation data points collected along predefined vehicle travel paths yield a clear spatial derivative. A profiler walking directly across a doweled joint records whether both adjoining slabs have dipped into a shared depression basin or whether one slab has uncoupled from its load-transfer mechanism. Uncoupled dowels produce an abrupt step change under vehicle transit.
Laser displacement sensors mounted to loaded counterbalanced forklifts record dynamic joint deflection under actual operational speeds.
Subbase voids eliminate uniform bottom support. When the soil drops away from the underside of the concrete, the slab acts as a structural cantilever beam under loaded reach trucks. Bending tensile stresses concentrate on the top surface roughly one meter back from the joint face.
Transverse flexural cracks appear parallel to the joint seam.
ASTM E1155 floor profiler measurements taken ninety days post-pour establish the legal baseline against which subsequent tenant-induced surface wear is isolated.
Tenants dispute settlement claims by arguing that floor contractors failed to vibrate concrete properly around dowel baskets, leading to early mechanical looseness under routine warehouse traffic.

Durometer
Wheel hardness governs localized contact stress distribution across the wearing surface of industrial concrete. Material handling equipment fleets utilize diverse compound compositions across steer tires, load wheels, and caster assemblies. The international tire standard DIN 53505 and ASTM D2240 classify tire hardness via Shore A and Shore D durometer scales.
Softer tires distribute load over larger contact patches, suppressing peak contact stress.
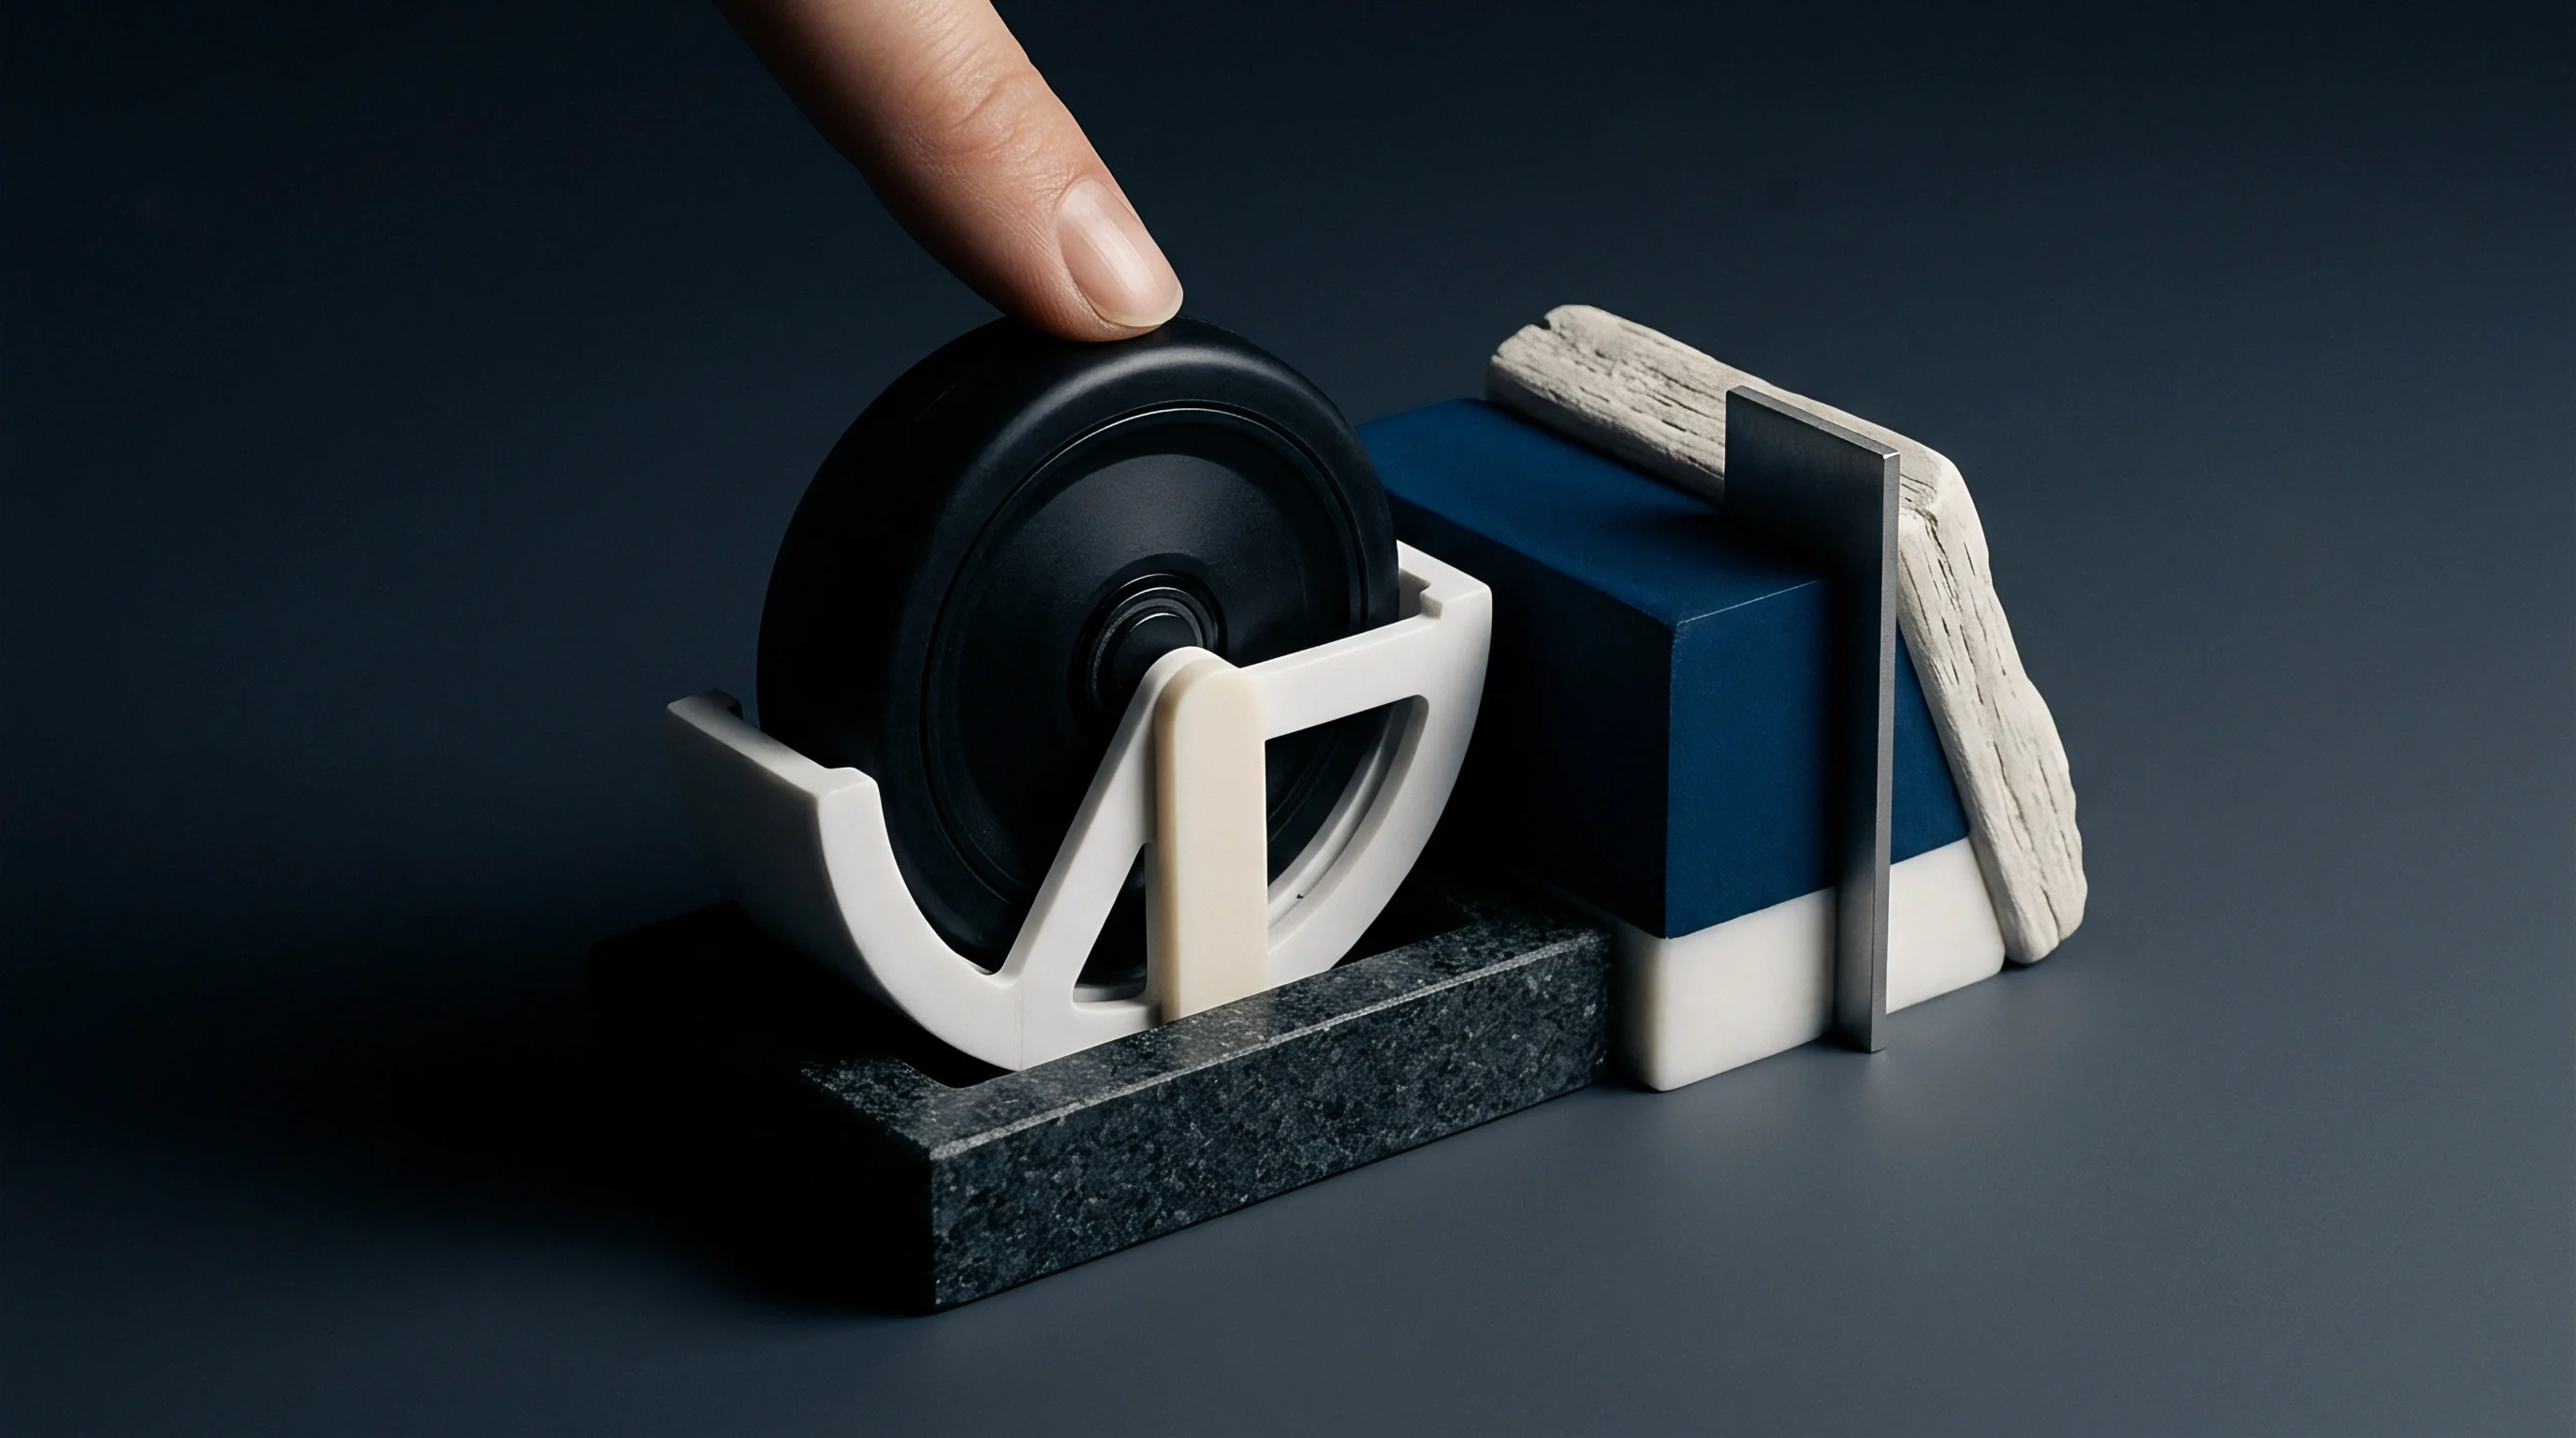
Harder tires minimize rolling resistance and maximize battery life on electric reach trucks and automated guided vehicles. Solid polyamide, cast nylon, and hard phenolic wheels reach 85 to 95 Shore D hardness. These compounds behave like rigid steel cylinders rolling directly over brittle mortar matrices.
The contact footprint shrinks to narrow strip patches under 15 square centimeters under a five-tonne wheel load.
Contact Stress Dynamics
Dynamic contact pressure scales nonlinearly with durometer rating. Standard 80 Shore A polyurethane wheels deform elastically under static load, creating a contact footprint of 45 to 70 square centimeters. The resulting compressive stress lands between 3.5 and 5.5 megapascals, well below the 35 megapascal compressive strength of standard C28/35 warehouse concrete.
When a fleet manager swaps worn polyurethane wheels for 90 Shore D cast nylon to gain operational speed, the contact footprint contracts sharply.
| Compound Composition | Durometer Rating | Footprint Area | Dynamic Contact Stress |
|---|---|---|---|
| Pneumatic Industrial Rubber | 60 to 70 Shore A | 120 to 180 sq cm | 0.8 to 1.5 MPa |
| Standard Vulkollan Polyurethane | 80 to 85 Shore A | 45 to 65 sq cm | 3.8 to 5.5 MPa |
| High-Density Hard Polyurethane | 93 to 98 Shore A | 22 to 35 sq cm | 8.0 to 14.5 MPa |
| Cast Nylon / Phenolic Resin | 85 to 95 Shore D | 8 to 14 sq cm | 24.0 to 42.0 MPa |
Peak dynamic contact stress exceeds the tensile cracking threshold of concrete paste when hard wheels traverse micro-uneven joint margins. The resulting impact micro-spalls the top aggregate layer. Concrete dust generated by wheel grinding enters surrounding inventory racks.
Fleet logs must document wheel replacements across all operating machines. Diligence audits show that third-party maintenance contractors frequently substitute harder wheel compounds during routine servicing without consulting facility lease covenants. Softer wheels wear out faster.
Harder wheels sacrifice the building floor to prolong tire replacement intervals.
Harder wheel tires protect fleet maintenance budgets while destroying building slab integrity.
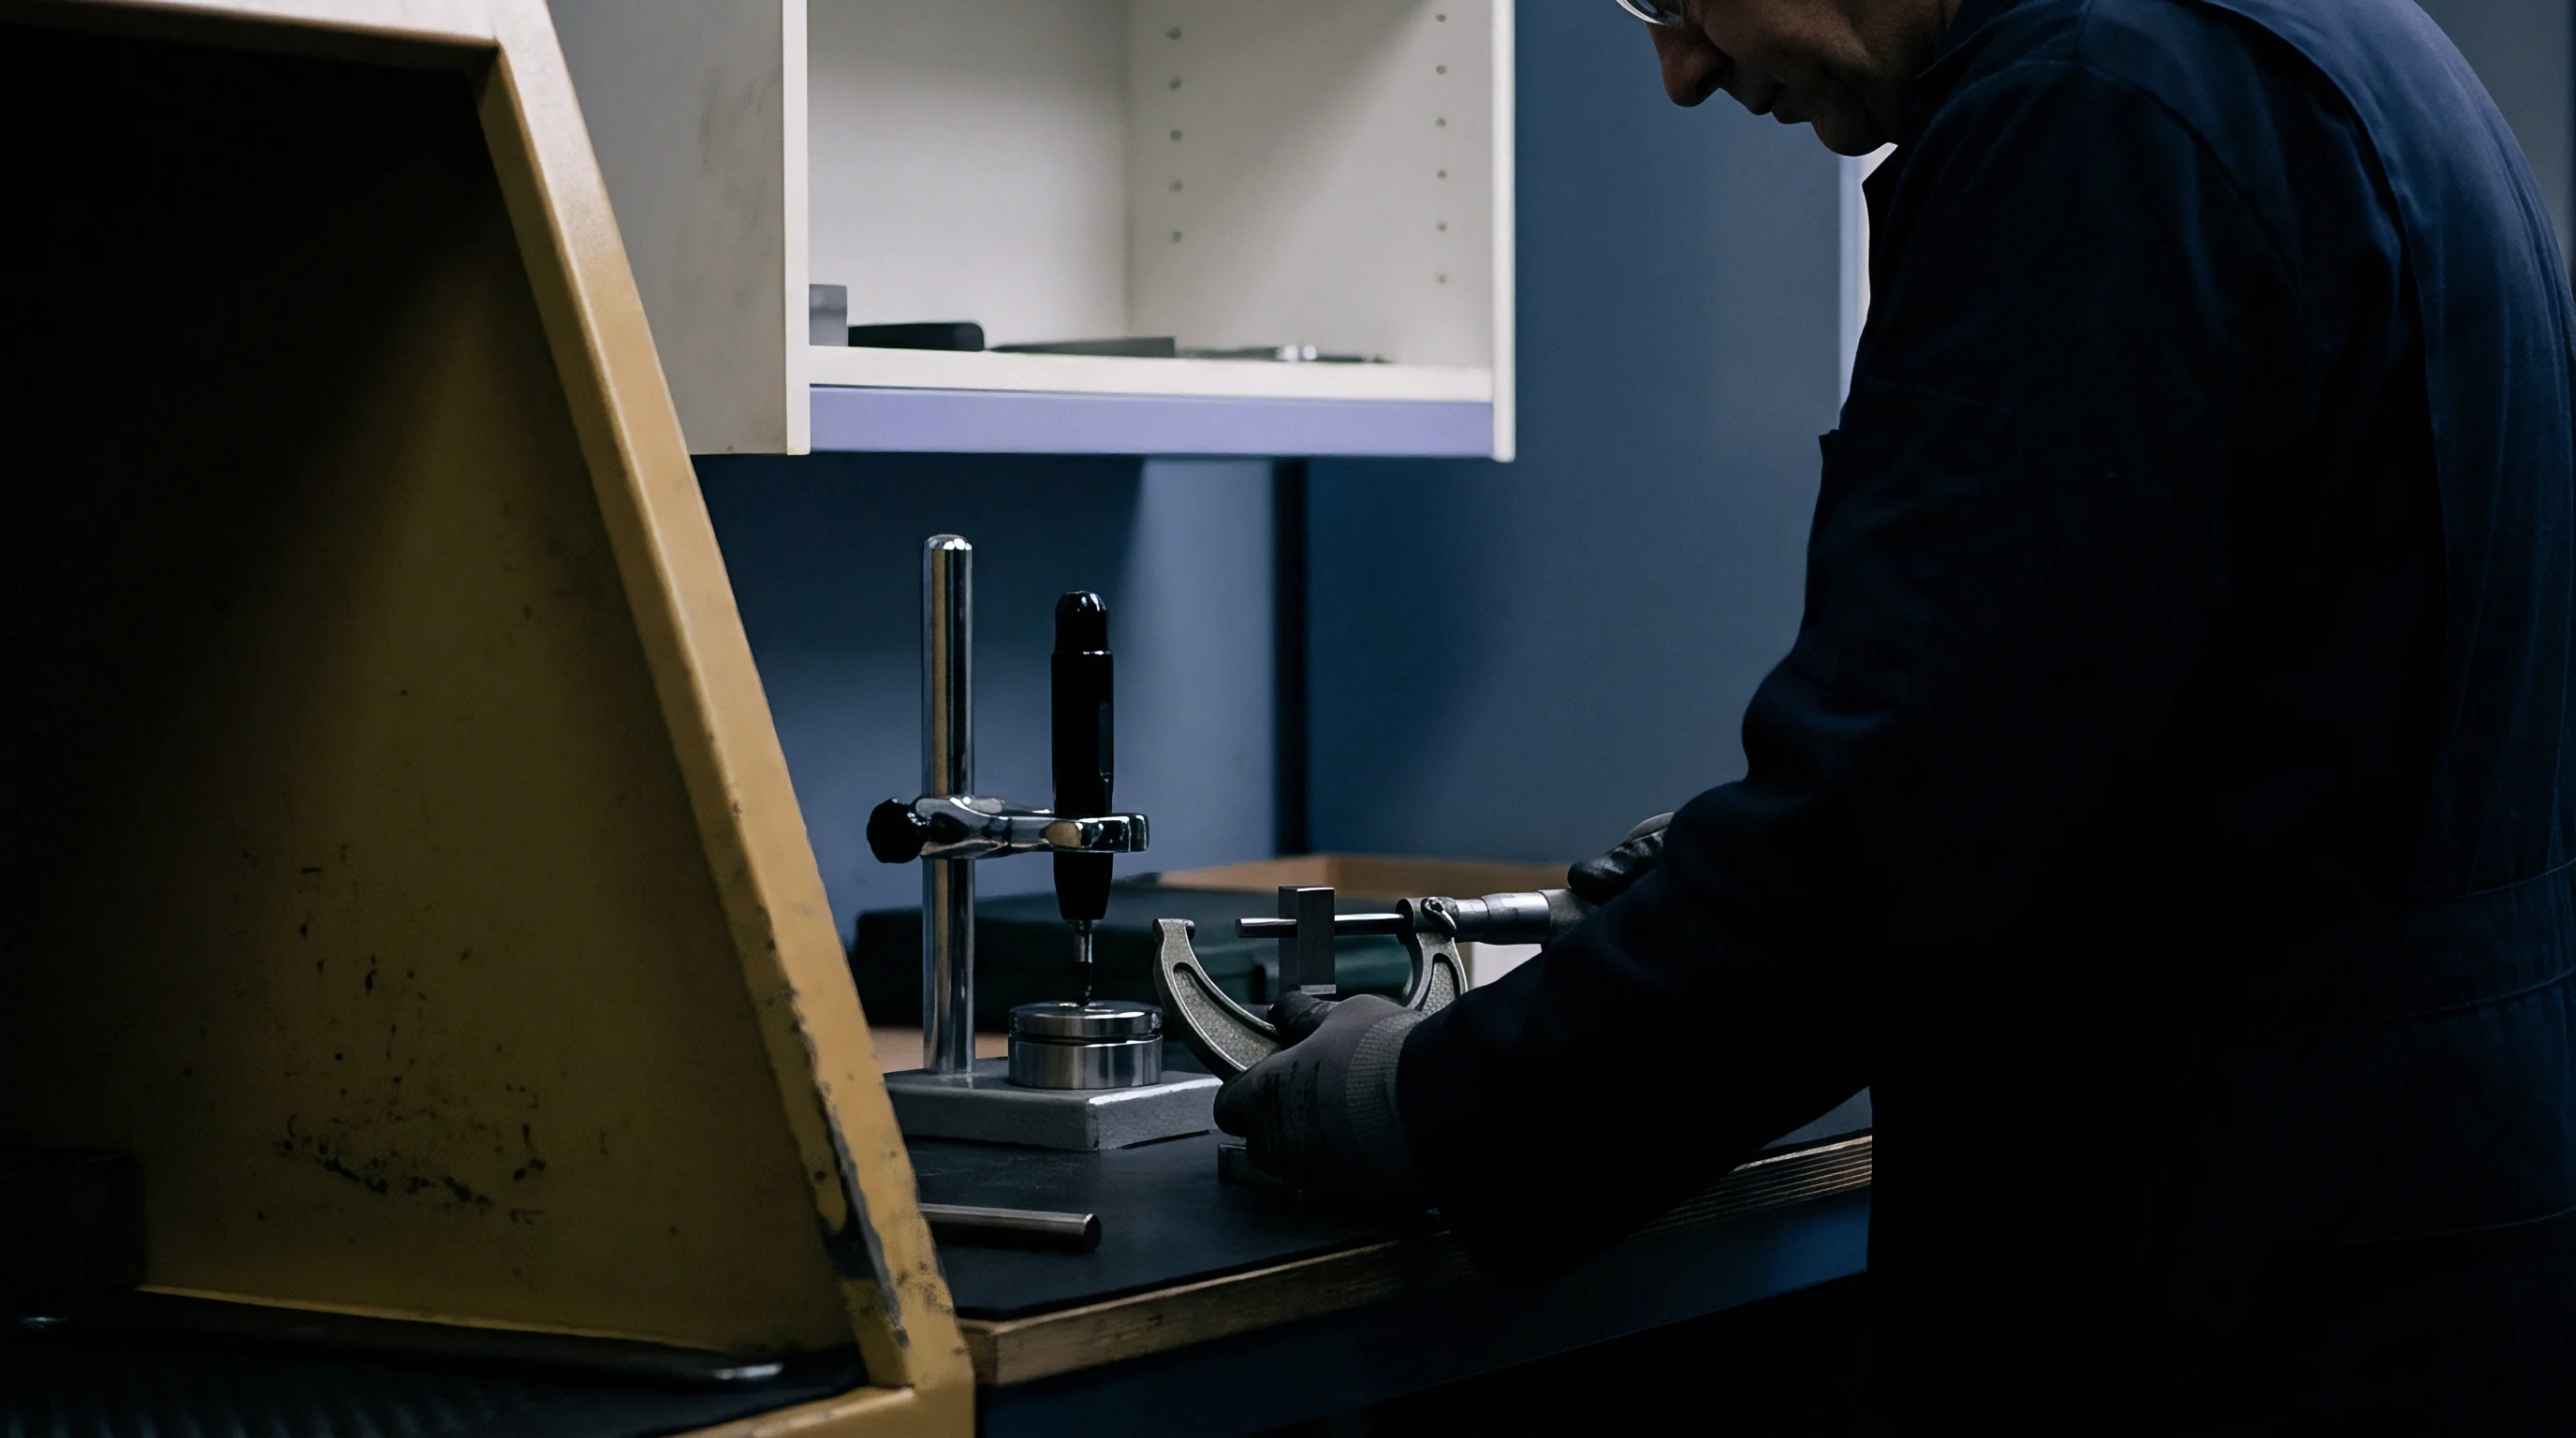
Audit procedures catch unauthorized wheel alterations. The diligence team conducts random site checks across the fleet using calibrated handheld durometers across steer and load wheels.
Checking tire shore hardness across every active vehicle prevents unapproved fleet alterations from transferring running gear expenses into building structural dilapidation claims.
Allocation
Fair cost partitioning across multiple facility tenants requires mathematical reconciliation of three operational variables: metered wheel hardness, recorded vehicle passes, and verified differential settlement. Multitenant logistics parks share main travel aisles, staging docks, and cross-over passages. When floor damage appears along common transit spines, landlords cannot fairly apply simple square-meter lease area apportionment percentages.

What Validates Dynamic Contact Pressure across Joints?
Allocating repair expenses demands an analytical damage index based on cumulative contact stress energy. The total mechanical energy transferred to a joint margin correlates directly with the fourth power of dynamic axle loading, tire contact footprint stress, operating vehicle velocity, and the geometric step height across the joint.
Vehicle telemetry logs record transit events across common warehouse paths. Modern telematics capture operational hours, gross vehicle weights, operating travel speeds, and path trajectories via indoor radio positioning or optical guidepath sensors. Combining telemetry pass logs with durometer inspection records allows precise calculation of each tenant’s proportional damage factor.
A multi-factor mathematical damage allocation model assigns fractional liability through explicit operational parameters:
- Dynamic contact stress index calculates the peak localized pressure applied by the operational wheel compound under peak static mast loads.
- Cumulative axle transit count quantifies the total number of bidirectional loaded vehicle passes across individual shared joint segments over the assessment window.
- Vertical joint faulting factor isolates the proportional structural baseline jump height caused by subgrade consolidation from tenant mechanical abuse.
- Operating vehicle speed multiplier accounts for dynamic kinetic shock energy amplification occurring when rigid wheels impact elevated joint edges at full throttle.
Consider an operational case walking through a shared 60-meter dock transit aisle shared by two third-party logistics operators over a twelve-month reporting period. Assume total joint repair and structural polyurethane foam sub-grouting costs reach 84,000 euros. Metrology records from continuous digital inclinometer profilers establish that subgrade consolidation produced an initial 2.5-millimeter differential step across four transverse joints within the shared zone.
Concrete structural design standards identify this 2.5-millimeter displacement as a landlord base-building defect that triggers secondary impact loading.
Tenant A operates reach trucks equipped with factory-approved 82 Shore A polyurethane load wheels carrying an average 3.2-tonne axle load at controlled speeds capped at 8 kilometers per hour. Telemetry records document 42,000 passes across the faulted joint line. Tenant B operates automated guided pallet trucks retrofitted with 92 Shore D hard nylon wheels carrying 4.5-tonne axle loads at 14 kilometers per hour, logging 38,000 recorded passes.
Contact mechanics establish that Tenant B produces 4.8 times higher dynamic peak contact stress per pass than Tenant A. When multiplied by total axle counts, speed multipliers, and contact pressures, Tenant B generates 81 percent of the cumulative mechanical impact shock energy along the joint shoulders. The baseline structural faulting contributed 35 percent of the initial damage environment by failing to provide an even rolling plane. The cost apportionment divides cleanly: landlord subgrade stabilization pays 29,400 euros, Tenant A pays 10,374 euros, and Tenant B pays 44,226 euros.
How should forensic auditors apportion secondary crack branching when unrecorded historical tenants introduced unquantified wheel wear before digital telemetry tracking began?
Recovery
Enforcing financial chargebacks for slab degradation requires integrating technical metrology into lease documentation. Standard commercial leases rely on general obligations to maintain the premises in good repair. Broad lease covenants regularly collapse during formal commercial arbitration when tenants contest vague wear-and-tear exceptions.
Owners must draft specific operating criteria into lease schedules before tenant operations commence.

Lease Governance and Technical Baselines
Dilapidation recovery fails without verifiable entrance condition documentation. A formal baseline joint survey captures initial elevation variations, dowel load-transfer efficiency, and joint seal conditions prior to tenant occupancy. The lease schedule defines explicit acceptable operational boundaries for material handling equipment.
- Conduct an intake optical floor flatness survey complying with ASTM E1155 within thirty days prior to lease handover, filing the raw digital profile data in escrow.
- Establish an equipment register logging maximum allowable vehicle axle weights, mast capacities, and approved tire compound hardness ranges for every machine class.
- Execute quarterly continuous floor metrology passes along designated heavy-traffic paths to catch joint stepping and curl progression before edge spalling initiates.
- Inspect wheel compounds across all active tenant handling equipment using calibrated durometers during scheduled maintenance checks, red-tagging unauthorized hard tire replacements.
- Trigger financial escrows for joint reconstruction when quarterly surface profile audits reveal accelerated localized breakdown exceeding established tolerances.
Facility managers prevent joint failure by combining metrology data with aggressive preventive maintenance. Polyurethane joint sealants preserve joint shoulder concrete by preventing hard wheel edges from dropping directly into the open saw-cut gap. When sealants tear or dry out under high-volume operations, edge concrete loses lateral support.
Wheels immediately chip away unsupported aggregate borders.
Repair specifications must match technical root causes. Pumping structural polyurethane or micro-cement grouts beneath the slab consolidates loose subgrade soil and restores vertical load transfer. Surface grinding levels curled joints back to flat plane tolerances.
Vacuum-impregnated elastomeric joint rebuilds replace broken concrete shoulders with impact-absorbing structural polymers designed to survive high-durometer wheel strikes.
Commercial contracts that include explicit mechanical wear definitions transform contentious lease-end dilapidation lawsuits into straightforward arithmetic reconciliations based on metrology and equipment logs. Lease Schedule C standard clauses define maximum wheel durometer ratings at 85 Shore A and require tenants to submit quarterly vehicle fleet wheel maintenance records, enabling immediate landlord recharges for premature concrete joint rehabilitation without protracted arbitration disputes.