Capillary Rheometry Data Corrections for Polymer Processing Accuracy
Correcting raw capillary rheometry data for entry losses, shear gradients, and wall slip prevents costly tooling rework and protects gross margins.
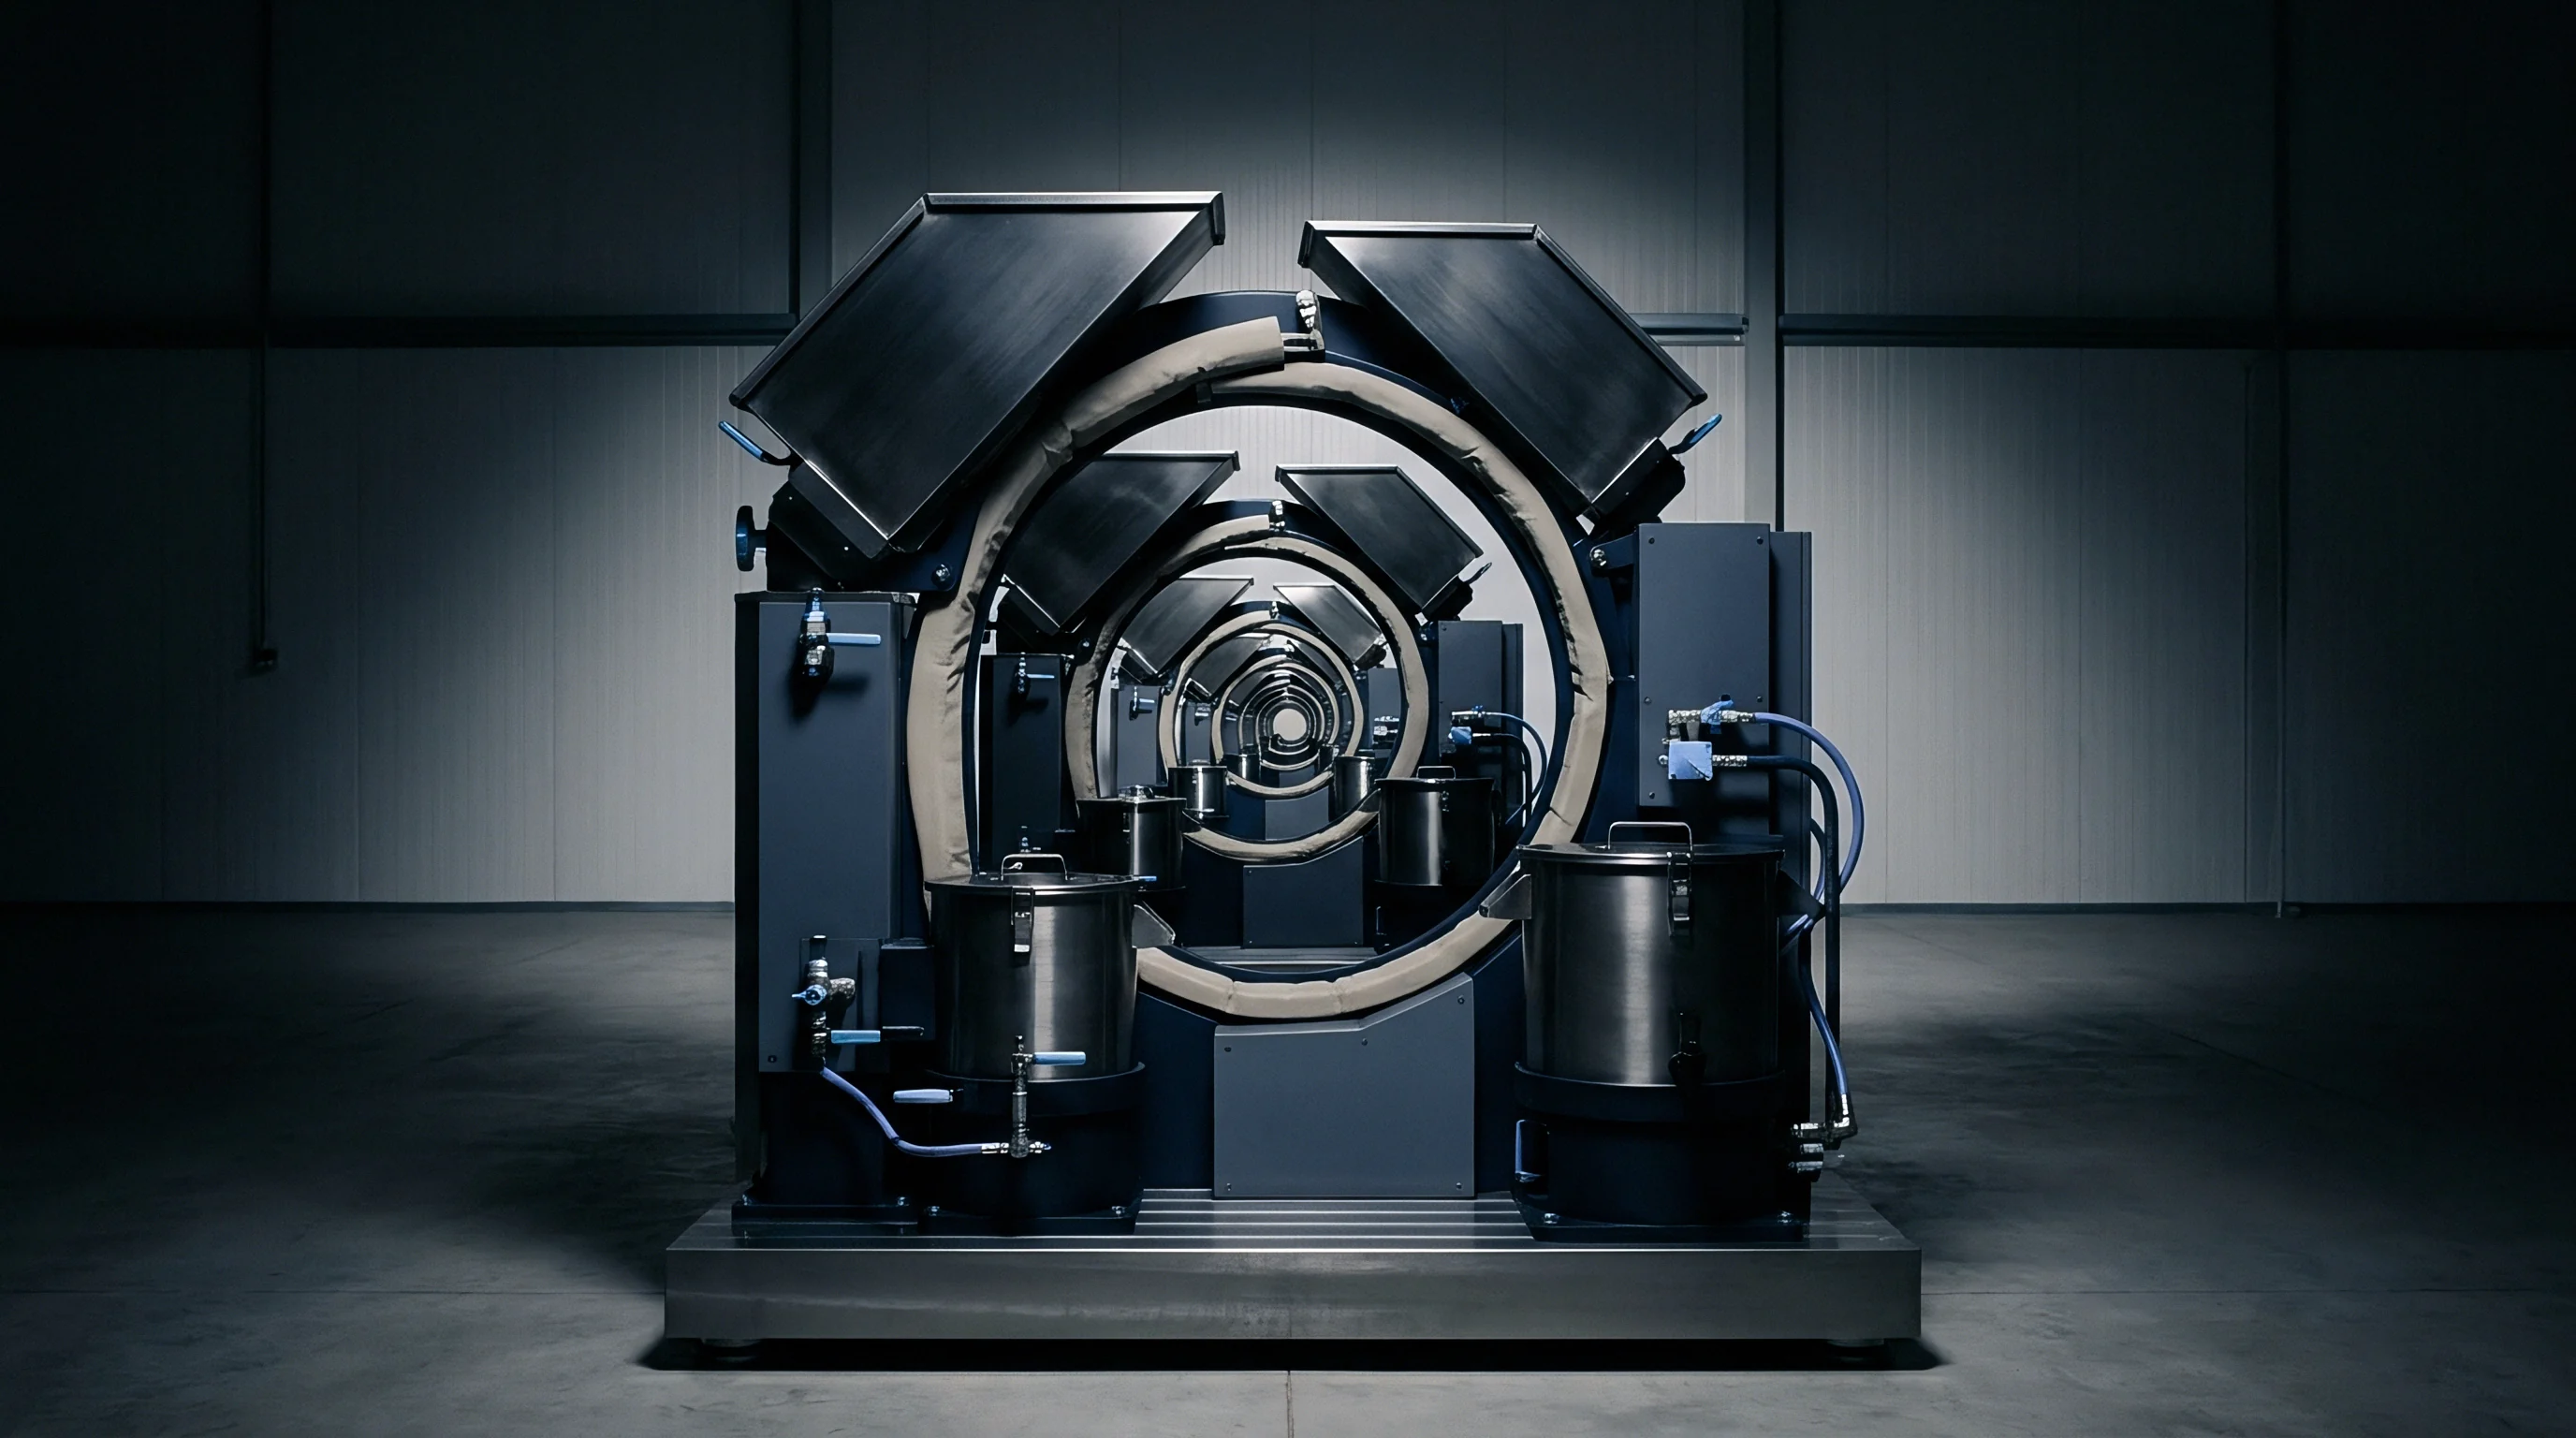

Die
Pressure drops at the entrance and exit of a test channel introduce significant error into raw capillary data. As polymer melt funnels from a wide barrel into a narrow orifice, the converging streamlines set up heavy extensional deformation and store elastic energy. The resulting energy loss occurs entirely outside the channel’s uniform shear zone.
Because standard capillary rheometers log the total pressure drop across the whole assembly, they treat all resistance as simple wall friction within the bore. Calculating shear stress straight from this unadjusted pressure overstates viscous resistance by 15 percent to 40 percent in typical geometries.
Entrance pressure losses scale with resin elasticity, molecular weight distribution, and channel dimensions. Capillaries with length-to-diameter ratios below ten show the worst proportional error, since entry effects account for most of the total recorded force. Isolating those losses requires the multi-die method developed by Bagley: testing the melt through at least three dies with the same orifice diameter but different lengths separates entrance and exit losses from shear resistance inside the channel.
| Capillary L/D Ratio | Raw Pressure Drop (Bar) | Entrance Loss Percentage (%) | Uncorrected Viscosity Overstatement (%) | Corrected Shear Stress (kPa) |
|---|---|---|---|---|
| 5:1 | 142.5 | 38.2 | 36.8 | 68.4 |
| 10:1 | 215.0 | 25.3 | 22.1 | 80.3 |
| 20:1 | 358.0 | 15.2 | 11.4 | 76.0 |
| 30:1 | 502.0 | 10.8 | 6.2 | 75.4 |
Plotting total measured pressure against length-to-diameter ratio at a set apparent shear rate produces a straight line. Projecting that line back to zero length reveals the combined entrance and exit loss as the intercept. Subtracting that value from raw pressure readings leaves the true, fully developed wall shear stress needed for flow modeling.
Alternatively, an orifice die with an effective length near zero measures entrance losses directly in one pass, speeding up high-throughput characterization runs.
A capillary die length-to-diameter ratio below sixteen introduces entry pressure losses that exceed twenty percent of total measured barrel force.
Ignoring entry resistance skews mold-filling simulations from the start. Tool designers working from raw viscosity curves predict artificially high injection pressures, leading to oversized Clamping units, bloated capital expenses, and thick gates that leave cosmetic witness marks on molded parts. ASTM D3835 requires reporting both length-to-diameter ratios and die entry angles, invalidating resin data sheets whenever single-die numbers are presented without Bagley corrections.

Shear
Flow through a capillary channel does not generate the straight velocity profiles seen in simple Newtonian liquids. Molten polymers thin under shear: local viscosity drops as deformation rates rise across the channel cross-section. The velocity profile through a round orifice flattens across the center and steepens near the wall, diverging from Newtonian flow assumptions.
When a rheometer calculates wall shear rate using standard parabolic equations, it underestimates the actual shear rate at the boundary layer.
Converting apparent values into true wall shear rates requires the Weissenberg-Rabinowitsch correction. This calculation relates changes in apparent shear rate to true wall shear stress on a logarithmic scale. The correction factor is derived directly from the slope of that log-log curve, reflecting the non-Newtonian index of the melt.
Skipping this correction distorts resin characterization and carries clear consequences for extrusion dies and feed systems:
- Apparent Rate Underestimation causes mold software to understate wall velocity gradients, leading to tight feed channels that overheat the melt during fast injection.
- Power-Law Slope Truncation masks the sharp shear-thinning that happens above one thousand inverse seconds, throwing off gate pressure calculations.
- Extrusion Swell Miscalculation combines raw stress and uncorrected rate data, yielding poor land length targets that fail to hold profile tolerances.
- Melting Zone Pressure Distortions warp screw design equations in single-screw extruders, prompting operators to run higher barrel temperatures to counter phantom flow resistance.
Taking the Weissenberg-Rabinowitsch derivative adjusts raw capillary measurements to true wall conditions. Highly pseudoplastic resins produce slope values well below unity, pushing corrected shear rates up to fifty percent past raw instrument readings. Sizing calculations that skip this step misjudge viscous dissipation in high-shear gates and narrow die lands.
True wall shear rates in pseudoplastic polymer melts exceed raw apparent calculations by thirty to fifty percent in high-shear processing channels.
Basic single-point melt flow index values and unadjusted capillary curves remain common in resin data sheets, though neither provides enough detail for tooling sign-off.

Heat
High-rate capillary flow turns mechanical work into local temperature spikes within the melt. Energy supplied by the rheometer piston converts to heat through friction between sliding polymer chains. Because molten polymers conduct heat poorly, that thermal energy stays concentrated in the core of the stream during its brief pass through the capillary.
This internal heating pulls melt viscosity below what it should be at the set test temperature, depressing shear force readings at higher shear rates.
Viscous heating scales with the square of both shear rate and channel radius. Pushing test rates past two thousand inverse seconds can raise core stream temperatures by more than fifteen degrees Celsius. These non-isothermal conditions undermine standard rheological assumptions, since recorded pressure drops reflect a temperature gradient rather than the set barrel setpoint.
Assessing viscous heating requires calculating the dimensionless Nahme-Griffith number, which balances viscous heat generation against conduction across the channel radius. Once this ratio passes unity, shear heating governs flow behavior and raw viscosity curves roll off, mimicking severe shear-thinning that has nothing to do with molecular structure.
Managing thermal softening takes both analytical corrections and sensible die selection. Smaller bore diameters curb heat buildup by shortening the conduction path to the temperature-controlled steel walls. On the analytical side, raw stress data can be adjusted using temperature coefficients pulled from low-rate, isothermal rotational tests run across several temperatures.
Internal viscous dissipation lowers observed melt viscosity during high-rate testing, mimicking artificial shear-thinning behavior.
Pairing high-shear capillary runs with small-diameter dies keeps internal temperature swings inside a manageable three-degree band.


Yield
Highly filled compounds, fluoropolymers, and elastomeric grades frequently slip at the wall, violating the no-slip boundary condition assumed in classical fluid mechanics. Instead of sticking to the capillary surface, the melt slides directly against the metal, or moves across a thin, low-viscosity lubrication layer. Standard rheological formulas assume all volumetric flow comes from shearing within the fluid.
When slip occurs, measured throughput reflects a mix of shear and plug flow, making the resin look far less viscous than it actually is.
Detecting and quantifying slip velocity requires testing across dies of different diameters while holding the length-to-diameter ratio fixed. The Mooney method compares apparent shear rates across those diameters at identical wall shear stress levels. Plotting apparent rate against the reciprocal of capillary radius produces a straight line whose slope gives the slip velocity for that specific stress.

Why Does Uncorrected Rheological Data Distort Mold Pressure Predictions?
Uncorrected data distorts cavity pressure calculations because flow solvers assume all movement comes from bulk shear. Feeding slip-affected laboratory data into simulation software causes the solver to treat slip as low melt viscosity. In production tooling ~ where steel finishes, flow lengths, and mold temperatures differ from test dies ~ slip behavior changes, sending actual cavity pressures far above simulated targets.
Clamping tonnage falls short, mold parting lines open, and parts flash.
Extracting true bulk rheology and slip parameters requires a defined sequence:
- Perform multi-die capillary testing using at least three distinct length-to-diameter ratios to obtain raw pressure curves across the target shear rate range.
- Execute Bagley linear regressions on raw pressure readings to subtract entrance and exit pressure drops, isolating true wall shear stress values.
- Conduct duplicate Bagley-corrected test sweeps across three distinct capillary die diameters while holding length-to-diameter ratios constant.
- Plot Bagley-corrected apparent shear rates against reciprocal capillary radii for identical wall shear stress targets.
- Calculate Mooney wall slip velocities from the slopes of these linear reciprocal radius plots across all stress increments.
- Subtract slip velocity contributions from total flow rates to establish true bulk shear rates.
- Apply the Weissenberg-Rabinowitsch derivative to true bulk flow curves to establish final, fully corrected non-Newtonian viscosity profiles.
Consider an automotive housing program using fifty tonnes of thirty-percent glass-filled polyamide. Single-die testing showed an apparent viscosity of two hundred ten Pascal-seconds at one thousand inverse seconds. Tooling engineers used that raw figure to size gates and runners, calculating a peak filling pressure of seven hundred eighty bar and selecting an eight-hundred-tonne press to hold the tool closed.
Full correction altered those parameters substantially. A Bagley evaluation showed a forty-five bar entrance loss, lowering calculated wall shear stress. Mooney plots across three die diameters then revealed a wall slip velocity of twelve millimeters per second, showing that eighteen percent of measured lab throughput was boundary slip rather than material shear.
After applying the Weissenberg-Rabinowitsch correction, true bulk viscosity reached two hundred eighty-five Pascal-seconds at operating temperatures ~ thirty-five percent above the initial bench reading.
Designing the runner system around the raw two hundred ten Pascal-second figure would have left the feed channels undersized. Actual cavity pressures would have hit nine hundred ninety bar in the press, blowing past Clamping limits, flashing the mold, and triggering forty-five thousand dollars in tool rework alongside three weeks of downtime.
Unchecked wall slip during extrusion die sizing creates drag, pressure surging, and melt fracture, forcing operators to back off line speeds and cutting margin per kilogram.

Outlay
Poor rheological data translates directly into higher scrap, lengthy commissioning, and unplanned mold modifications. Hardened steel tools that fail to pack out or hold wall thickness require costly rework. Re-machining runners, opening gates, or modifying extrusion tooling after delivery burns capital that was earmarked for plant expansion.
The operational fallout carries over into inventory and material costs. Processors struggling to stabilize parts molded from flawed viscosity models often shift to higher-flow, premium-priced resin lots to ease mold filling. Meanwhile, inventory sitting idle while tools are off-line for rework ties up credit lines and pushes holding days past working capital targets.
| Operational Metric | Uncorrected Rheology Data | Fully Corrected Rheology Data | Variance / Financial Impact |
|---|---|---|---|
| Tooling Modification Rounds | 3.4 Iterations | 0.3 Iterations | 70% reduction in debug costs |
| Commissioning Time to Yield | 22 Production Days | 3 Production Days | 19 days accelerated cash conversion |
| Start-up Scrap Rate (%) | 8.5% | 1.2% | 730 bps gross margin improvement |
| Injection Mold Clamping Cushion | 35% Over-specified | 8% Optimized Buffer | $120,000 lower press capital cost |
| Inventory Holding Cycle Days | 64 Days | 38 Days | 26 days reduced working capital drag |
Validating resin viscosity data before approving tooling builds depends on technical requirements set directly in procurement contracts:
- Multi-Length Bagley Verification requires raw test files containing at least three distinct capillary length measurements to confirm entrance loss subtraction.
- Rabinowitsch Gradient Proof mandates raw volumetric data and derivative calculations establishing true wall velocity gradients across four decade shear rate ranges.
- Mooney Slip Analysis Reports require explicit verification of multi-diameter die sweeps whenever processing compounds contain mineral fillers, pigments, or fluoropolymers.
- Temperature Stability Logs certify that viscous heating numbers were monitored using Nahme-Griffith evaluations and held within a three-degree thermal window.
Uncorrected flow curves lead directly to higher unit costs. Scrap write-downs raise the cost of goods sold, lowering gross margins and pinching coverage ratios set by commercial lenders. When project qualifications stall, ongoing facility overhead eats into cash, requiring draws on credit lines to cover basic operational expenses.
Determining how much rework cost and scrap inventory a molding operation can absorb helps establish the point where multi-correction rheology data becomes standard across tool design programs.