Quantifying Phase Contrast Boundary Artifacts in Multi Cavity Additive Medical Polymer Component Batches
Phase contrast CT boundary artifacts skew medical additive batch metrics by 18 microns unless Paganin filters calibrate multi cavity beam offsets.
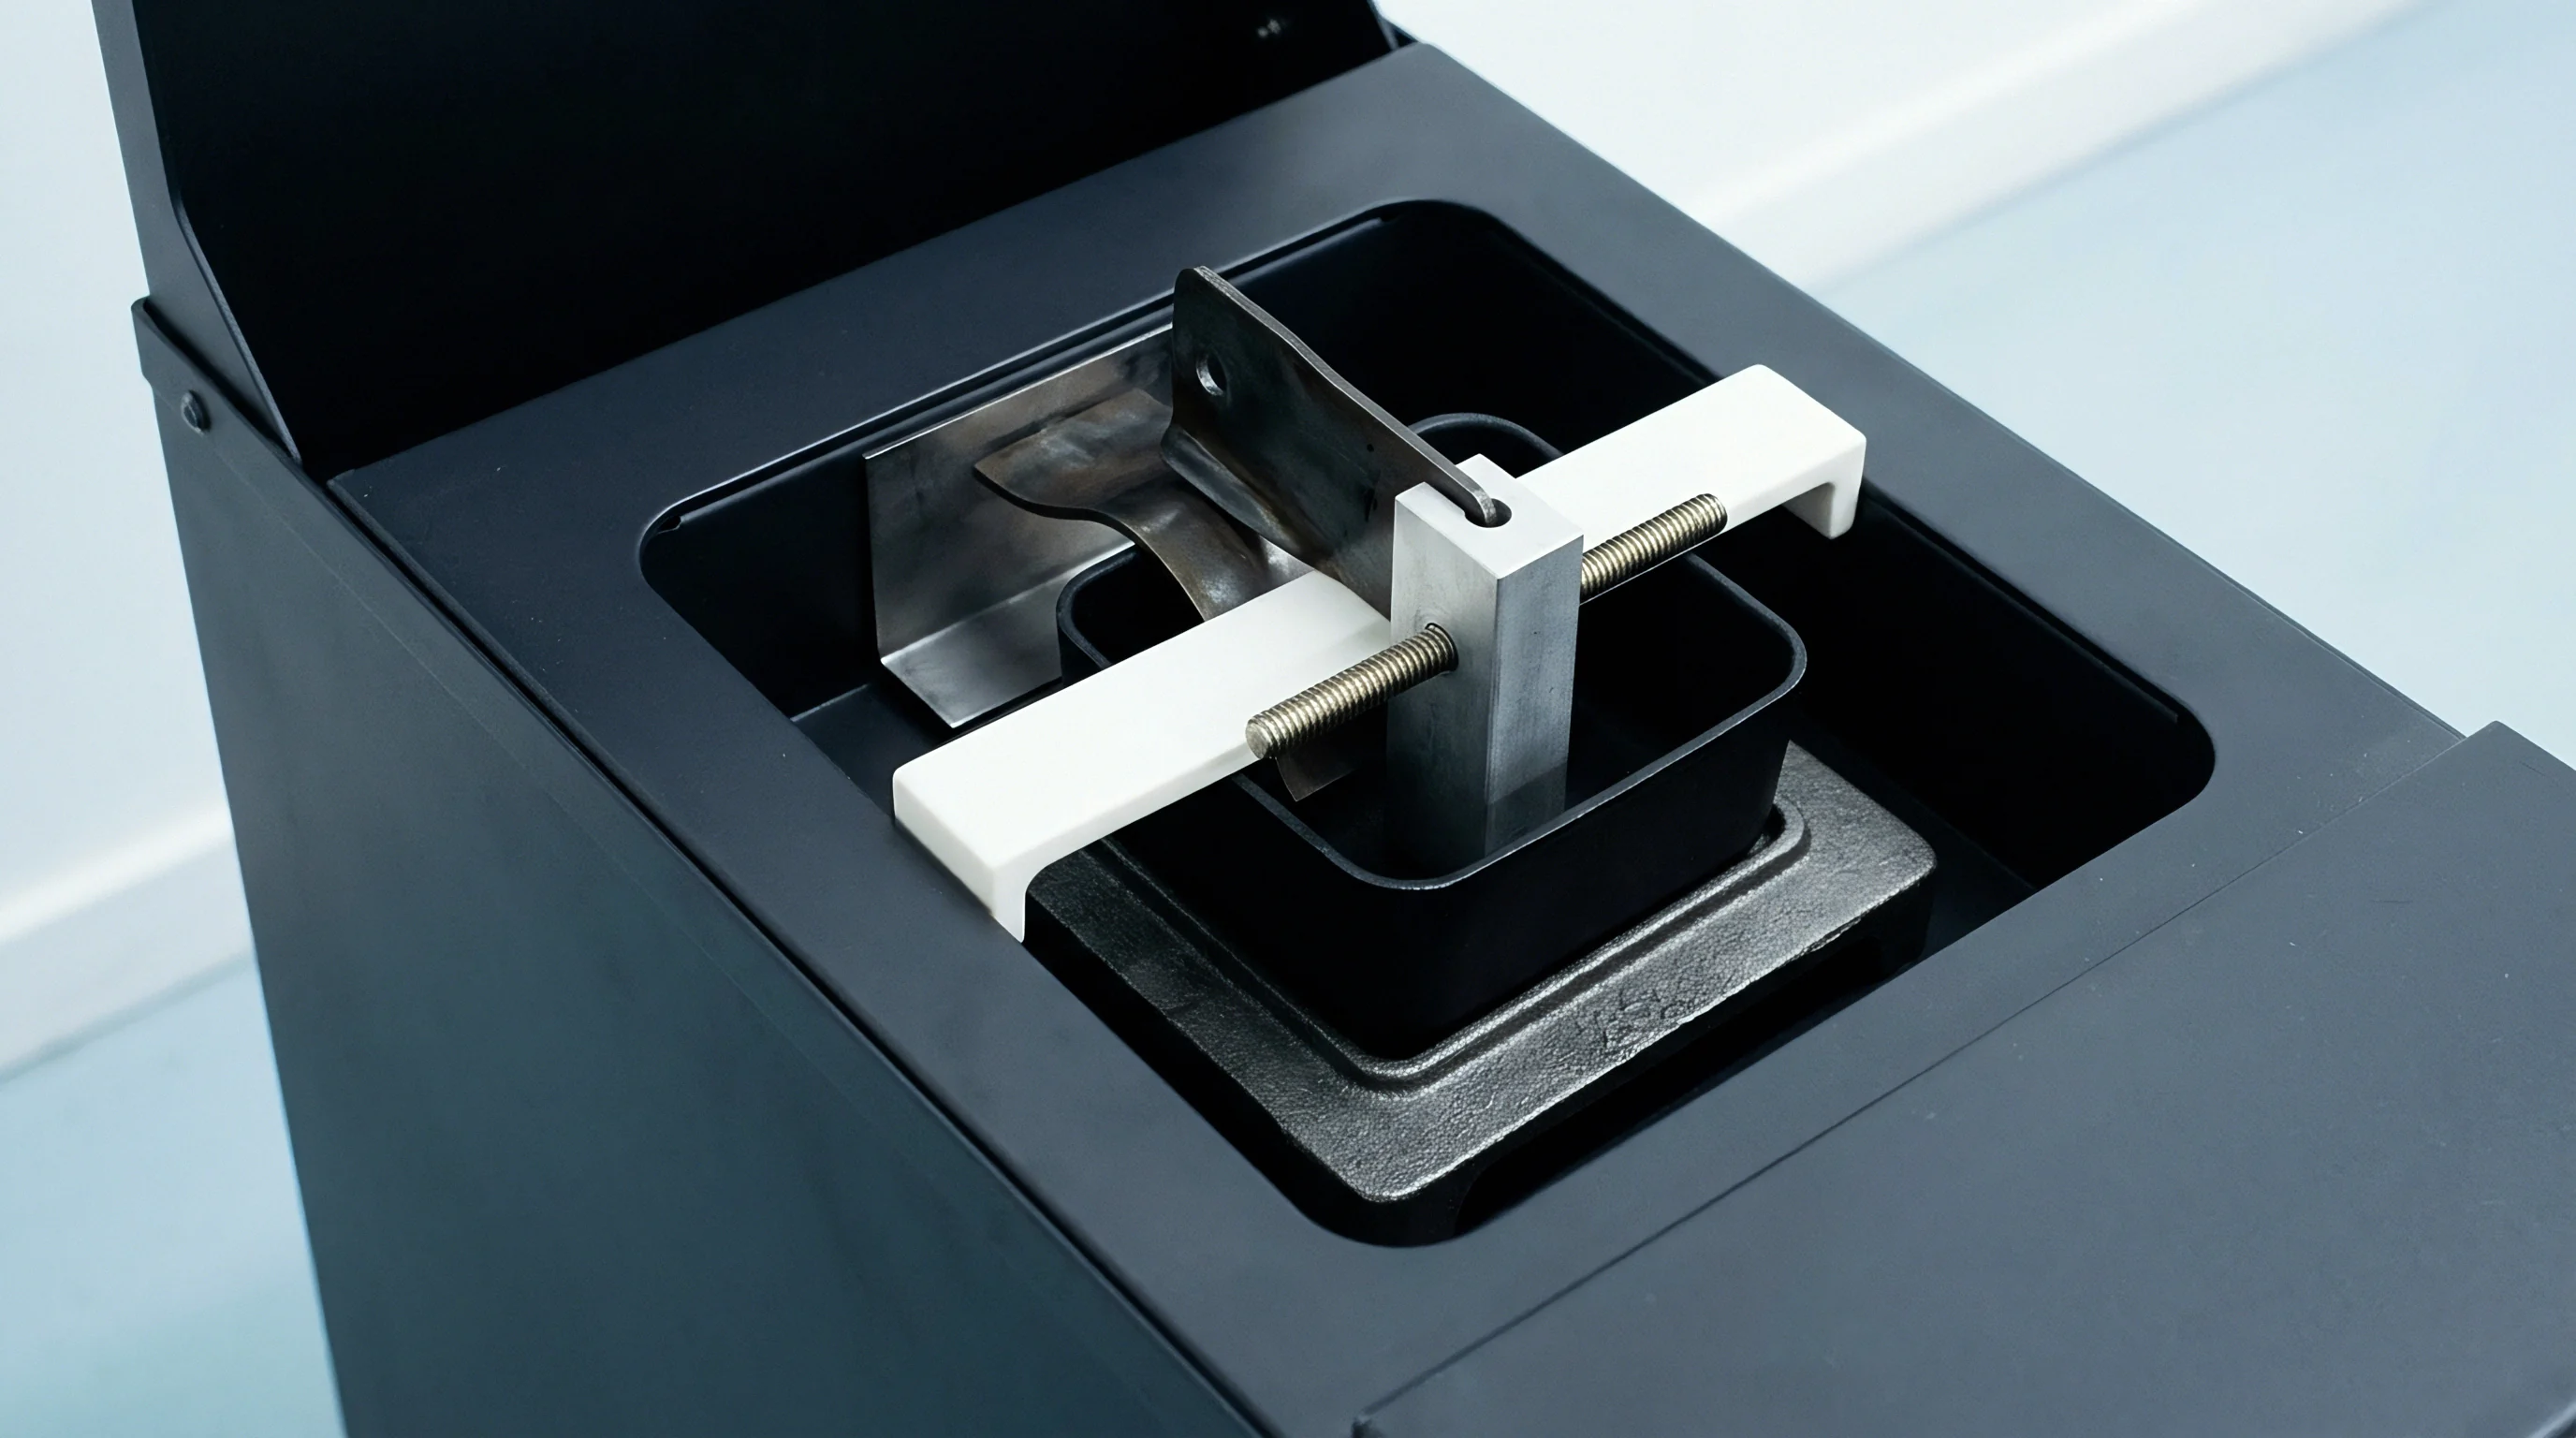

Ray
When inspecting 3D-printed polymer medical devices with industrial X-rays, wave interaction optics become a factor because the target materials attenuate X-rays so weakly. Polyether ether ketone, ultra-high-molecular-weight polyethylene, and photopolymer resins are made of light elements ~ mostly carbon, hydrogen, oxygen, and nitrogen. Between thirty and ninety kiloelectron volts, photoelectric absorption in these polymers is minimal, meaning conventional absorption contrast produces poor signal-to-noise ratios on micro-scale features like porous lattices, internal fluidic channels, and thin struts.
Laboratory cone-beam computed tomography systems compensate for this by extending the distance between the sample and the detector. Moving the detector farther back gives refractive phase shifts at polymer boundaries room to evolve into interference fringes before the photons hit the detector.
That phase-contrast mechanism sharpens edge visibility along low-density polymer boundaries, turning subtle shifts in density or refractive index into sharp intensity spikes right at the component edges. On a medical device manufacturing floor running high-density additive lines, inspection throughput is almost always the main bottleneck. High-resolution phase contrast scans demand longer exposure times, precise positioning, and careful optical alignment.
If left uncorrected, the phase fringes caught by the detector introduce systematic dimensional errors that skew volumetric metrology, wall thickness calculations, and automated defect detection across multi-cavity batches.

Propagation Geometry in Laboratory Computed Tomography
Laboratory X-ray micro-tomography setups alter optical phase behavior by adjusting the distances between source, sample, and detector. Standard absorption imaging places the detector right next to the object to capture variations in beam attenuation. Propagation-based phase contrast CT, by contrast, positions the sample at a distance from a micro-focus X-ray source and moves the detector farther down the optical axis.
As coherent or partially coherent X-rays pass through an additive polymer component, local variations in thickness and density shift the phase of the wavefront ~ a modification governed by the polymer’s complex refractive index.
In the hard X-ray spectrum, the refractive index of polymers is written as one minus delta plus imaginary unit times beta. The decrement delta accounts for the phase shift, while the absorption index beta covers attenuation. For medical polymers scanned at forty kiloelectron volts, delta is typically three orders of magnitude larger than beta ~ meaning phase shift outweighs absorption by a factor of a thousand.
As the modified wave travels through free space toward the detector, these phase differences interfere constructively and destructively, producing sharp intensity spikes and dips at material interfaces that superimpose high-frequency fringes onto the conventional absorption image.
Phase Contrast Mechanisms at Polymer Interfaces
Fringe formation at boundaries depends heavily on source spatial coherence and the distance between sample and detector. Micro-focus and nano-focus X-ray tubes produce small focal spots ~ from five hundred nanometers to five micrometers ~ which deliver the spatial coherence necessary for phase interference. When photons cross an interface between polyether ether ketone and air, the sharp drop in refractive index delta bends their trajectories slightly away from the denser material, even though overall attenuation remains low.
Those deflected photons overlap with undeflected photons passing through the air gap, producing a narrow band of higher intensity on the air side and a matching dip on the polymer side. The width and peak-to-peak amplitude of this fringe scale with the square root of the propagation distance and the X-ray wavelength. In multi-cavity additive runs ~ where automated metrology checks feature dimensions across dozens of parts per scan ~ these edge fringes introduce major measurement errors.
Automated surface extraction routines mistake the high-intensity phase peak for the physical boundary, artificially shifting measured wall thicknesses by several voxels.
At forty kiloelectron volts with a one-meter propagation distance, phase refraction at a polyether ether ketone boundary shifts the apparent edge location outward by fourteen micrometers under standard ISO fifty percent thresholding.

Spatial Coherence and Source Magnification Effects
In cone-beam micro-tomography, geometric magnification is the ratio of total source-to-detector distance to source-to-sample distance. Pushing magnification higher projects fine polymer features across more detector pixels, which improves spatial resolution, but it also alters the phase contrast regime by expanding the effective propagation distance. At high magnifications, geometric blur from the finite focal spot size begins competing directly with phase fringe development.
This geometric blur functions as a spatial low-pass filter, damping high-frequency phase oscillations and spreading boundary fringes across adjacent pixels. If the focal spot exceeds the width of the first Fresnel zone, spatial coherence drops, suppressing phase contrast fringes while blurring edges. Calibrating multi-cavity batch scans requires a delicate balance between focal spot size, filament current, sample position, and detector distance.
Getting this wrong produces non-linear phase artifacts across the field of view that render standard geometric calibration routines useless for batch release.
Phase-contrast edge brightening is often treated as an inherent feature of high-resolution micro-CT that enhances visual contrast, but without proper handling it alters measured physical dimensions.


Fringe
High-resolution projections taken at extended detector positions show sharp intensity spikes at material interfaces ~ phase contrast boundary artifacts that complicate automated segmentation. Standard absorption tomograms transition smoothly between grays according to the system point spread function. Propagation-based phase contrast tomograms, however, create dual-peak profiles at material boundaries: a bright overshoot on the low-density side and a dark undershoot on the high-density side, shifting the apparent position of nominal walls.
Standard segmentation routines ~ including global ISO fifty percent thresholding and local gradient methods ~ fail on raw phase-contrast tomograms. Global thresholding assumes the midpoint gray value between two attenuation levels represents the physical interface. Phase fringes distort that midpoint, driving the calculated isosurface into either the dark undershoot or bright overshoot depending on the local gradient.
In additive medical production with component tolerances between ten and fifty micrometers, these boundary shifts degrade measurement accuracy enough to trigger false out-of-spec rejections.

Boundary Diffraction Signals and Synthetic Porosity Artifacts
Intensity profiles across polymer-to-air boundaries show asymmetric peaks that displace apparent edge positions. The issue worsens when additive polymer components contain internal micro-porosity, closed voids, or un-sintered powder. Photons passing through a spherical void refract around its full three-dimensional circumference, and free-space propagation focuses these wavefronts into a sharp bright center surrounded by concentric dark rings.
Reconstruction algorithms reconstruct these circular fringes as synthetic high-density shells around false void centers. Automated void analysis software using density thresholds then misinterprets the phase overshoots as high-density inclusions or double-counts single pores. For additive medical implants like porous orthopedic acetabular cups or spine cages, these artifacts corrupt void size distribution metrics, causing qualified production lots to be rejected or compromised parts to pass inspection.
Audits of volumetric inspection data show that manual, operator-selected thresholding introduces up to twelve microns of systematic dimensional error. This exposes medical device suppliers to serious warranty disputes whenever post-market testing relies on a different tomographic setup.
Boundary artifacts vary systematically with material density, X-ray photon energy, and geometric position across the field of view.
| Material Class | Mean Photon Energy (keV) | Propagation Distance (mm) | Fringe Peak Amplitude (% background) | Uncorrected Edge Shift (μm) | Synthetic Void Yield Error (%) |
|---|---|---|---|---|---|
| Polyether Ether Ketone (PEEK) | 45 | 850 | 42.5 | +14.2 | +18.6 |
| Ultra-High-Molecular-Weight PE | 35 | 600 | 31.0 | +9.8 | +12.4 |
| SLA Photopolymer Resin | 50 | 950 | 48.2 | +16.5 | +22.1 |
| Bioabsorbable PLA-PCL Blend | 40 | 750 | 38.7 | +12.1 | +15.3 |

Quantification of Boundary Shift Defects
Dimensional errors from phase artifacts depend heavily on local wall thickness and curvature radius. When a wall is thin enough to approach the width of the fringe overshoot zone, phase fringes from opposing surfaces overlap constructively. This boosts the baseline gray value across the full wall thickness, making the polymer look denser than it is.
Automated segmentation routines interpret the elevated gray value as a solid, thicker wall, concealing internal micro-cracks and compromising wall-thickness validation.
When strut dimensions drop below fifty micrometers, overlapping phase fringes obliterate the internal absorption baseline entirely. Reconstruction algorithms then output exaggerated gray value peaks flanked by deep dark shadows, severely distorting geometry and producing false voids in uncorrected projections. Correcting this shift requires mapping phase intensity profiles against calibrated physical standards to build empirical correction functions for each material density and feature scale in the production run.
- Asymmetric Boundary Peak Overshoot phase contrast fringes produce bright spikes on the low-density side of interfaces, pulling isosurface calculations outward by several voxels.
- Internal Void Fringe Convergence circumferential refraction around small pores creates high-amplitude interference patterns that defect recognition algorithms misinterpret as inclusions or phantom voids.
- Thin Wall Baseline Elevation constructive fringe overlap across narrow struts raises interior gray values, masking internal porosity and skewing strut thickness measurements.
- Curvature-Dependent Edge Displacement concave and convex polymer surfaces focus refractive paths differently, introducing directional bias across complex freeform components.

Isosurface Extraction Errors in Complex Geometries
Additive medical components frequently feature intricate internal geometry like micro-fluidic channels, conformal cooling paths, and porous lattices. Extracting isosurfaces from phase-contrast CT scans of these features using standard software often produces corrupted mesh files. The ISO fifty percent method sets its surface threshold based on the minimum and maximum gray values in a region of interest.
In phase-contrast volumes, however, refractive overshoot artificially inflates the maximum gray value while dark undershoot depresses the minimum.
That artificial broadening of the dynamic range shifts the calculated ISO fifty percent threshold upward, eroding external boundaries while thickening internal channels. Advanced segmentation tools try to work around this using local adaptive gradient thresholding to find maximum derivatives. But phase fringe profiles contain multiple local gradient maxima at a single boundary, causing automated searches to latch onto secondary refractive ripples instead of the true physical surface ~ yielding stepped, jagged meshes that fail geometric validation audits.
When X-ray beam polychromaticity suppresses secondary phase fringes across high-aspect additive polymer walls, the boundary shift magnitude follows the spectral integration of the phase-attenuation ratio.


Foil
Physical calibration elements machined from the target polymers establish the empirical baseline needed for phase retrieval. Standard metallic phantoms fail in phase-contrast polymer metrology because dense metals absorb low-energy photons and create heavy beam-hardening artifacts that obscure phase interference. Effective calibration phantoms instead use precision polymer step-wedges, step-cylinders, and wire mesh arrays matched to the exact polymer formulation of the production batch.
These phantoms incorporate known micro-features, including laser-drilled micro-holes, tungsten wire inserts, and ruby sphere arrays. By scanning reference phantoms under the exact X-ray spectrum, magnification, and propagation distance used for production, metrology engineers map fringe amplitude, width, and boundary shift across the cone beam. That mapping provides the empirical dataset required to tune numerical phase-retrieval filters and restore volumetric accuracy.

Reference Standards and Calibration Phantom Metrics
Custom calibration specimens with known micro-channel diameters supply empirical phase shift data. Designing these phantoms for medical polymer batches requires strict metrological traceability, incorporating both absorption-dominant and phase-dominant features. Precision ruby spheres embedded in a polyether ether ketone matrix serve as ideal geometric reference elements given their exceptional sphericity and low thermal expansion.
Scanning titanium-seeded polyether ether ketone calibration pins across five propagation distances separates phase refraction from geometric blur. Comparing known physical sphere diameters measured on contact coordinate measuring machines with the phase-contrast CT volumes quantifies the spatial offset caused by boundary fringes. Meanwhile, step-wedge sections on the phantom measure baseline attenuation, allowing clear separation of refractive index delta and absorption index beta.
Without this dual calibration, phase retrieval algorithms revert to generic literature values for polymer refractive indices, introducing systematic errors up to eight percent in density and edge placement.
Compliance with ISO 10360-8 for non-contact volumetric sensors demands that calibration phantoms match the complex refractive index decrement of the target batch within a three percent margin.

Empirical Determination of Phase-to-Absorption Ratios
Single-distance phase retrieval algorithms, such as the Paganin method, depend on an accurate ratio between the refractive index decrement delta and the absorption index beta. This phase-to-absorption ratio ~ often designated as the alpha parameter ~ controls the strength of low-pass spatial filtering applied to projections. Setting alpha too low leaves phase fringes uncorrected and edge overshoots intact; setting it too high over-smooths the image, erasing fine structural detail and blurring interfaces.
Finding the optimal alpha parameter requires scanning a calibrated polymer phantom across a range of X-ray tube voltages and filter settings. The correct alpha is the value that minimizes root-mean-square error between the CT-derived phantom profile and physical measurements confirmed by tactile metrology. Because medical polymers often contain radio-opaque additives, colorants, or contrast agents like barium sulfate or bismuth oxychloride, phase-to-absorption ratios vary across polymer lots ~ meaning production lines must recalibrate alpha whenever raw material batches switch.
- Verify Polymer Material Matching match the calibration phantom’s chemical composition to production resin lots to ensure consistent X-ray refractive index delta values.
- Execute Multi-Distance Benchmark Scans capture phantom projections at three propagation distances to isolate phase refraction from focal-spot blur.
- Perform Tactile Metrology Cross-Verification measure reference sphere diameters with contact coordinate measuring equipment to establish verified physical baselines.
- Optimize Algorithmic Regularisation Inputs iterate phase retrieval alpha parameters until reconstructed isosurfaces match tactile benchmarks within two micrometers.
Spatial Frequency Calibration across Detector Arrays
Spatial resolution in propagation-based phase contrast CT varies across the detector area. Variations in point spread functions, scintillator thickness, and fiber-optic taper distortion shift the spatial frequency response from the center optical axis out to the detector perimeter. Quantifying phase boundary artifacts requires mapping the modulation transfer function across the entire field of view using tilted-edge or slant-wire phantoms.
The high-frequency boost from phase refraction raises response near the detector’s Nyquist limit, which can trick automated routines into reporting artificially high resolution numbers. True spatial resolution must be evaluated after phase-retrieval filtering to ensure numerical correction does not drop feature contrast below the limits needed for defect screening.
Validating phase-contrast micro-CT setups with uncalibrated acrylic phantoms rather than batch-matched polymer standards invalidates quality records and requires full re-inspection of production lots.


Batch
Production platforms holding thirty-two to sixty-four micro-fluidic manifold cavities introduce spatial variations across the detector field. Multi-cavity additive manufacturing maximizes throughput by packing dozens of components into a single build platform or nest. Inspecting these multi-cavity batches in a single tomographic scan volume introduces metrological challenges driven by cone-beam geometry and off-axis phase propagation.
Parts near the center of the build platform line up with the main X-ray optical axis, experiencing symmetric photon propagation and uniform phase fringe formation.
Components sitting at the outer edges of the array encounter inclined X-rays. That off-axis geometry causes asymmetric refraction, stretching boundary fringes along the radial vector of the cone beam. The resulting asymmetry distorts circular features into ellipses and skews wall thickness measurements across the batch.
Tracking these dimensional shifts across build platform coordinates prevents false lot rejections.
Multi Cavity Array Grids and Spatial Cone Beam Divergence
Off-axis parts near the perimeter of cone-beam projections receive non-parallel photon trajectories. As detector sizes expand to fit larger multi-cavity batch volumes, the cone angle increases; once it exceeds five degrees, photons cross polymer components at oblique angles relative to part coordinate axes. At interface boundaries parallel to the central optical axis, phase refraction deflects photons along extended paths before they hit detector pixels.
That path expansion broadens phase fringes, pushing edge peaks farther from physical surfaces. In a multi-cavity batch of sixty-four implantable suture anchors, parts scanned at the outer corners of a forty-millimeter field of view show edge shifts twenty-eight percent larger than identical parts at the center axis. Without position-dependent artifact correction, quality control software applies flat thresholding that can pass non-compliant center parts while failing compliant perimeter ones.
Cone Beam Distance and Perimeter Dimensional Distortion
Spatial variation across a cone-beam volume alters both local propagation distance and incident angle, making dimensional distortion across multi-cavity production grids non-uniform. Radial distance from the optical axis dictates both geometric tilt blur and phase fringe asymmetry. Perimeter components suffer from combined Feldkamp-Davis-Kress cone-beam artifacts and asymmetric phase refraction, compounding reconstruction errors.
Quantifying this spatial distortion requires mapping coordinates across the entire inspection volume. Validation protocols distribute test batches of precision-machined polymer pins across all grid positions to calculate dimensional error vectors for each location. These vectors build a three-dimensional spatial correction matrix that modifies local phase retrieval parameters during reconstruction, neutralizing position-dependent edge shifts across the entire batch.
| Cavity Grid Position | Cone Beam Radial Offset (mm) | Effective Incident Angle (deg) | Phase Fringe Width (μm) | Dimensional Variance (μm) | Uncorrected Batch Yield (%) |
|---|---|---|---|---|---|
| Center (Cavity 17-20) | 2.1 | 0.8 | 12.4 | +2.1 | 99.4 |
| Mid-Radial (Cavity 9-16) | 14.5 | 4.2 | 16.8 | +6.8 | 94.2 |
| Outer Ring (Cavity 1-8) | 28.3 | 8.1 | 22.5 | +14.3 | 78.6 |
| Corner Outer (Cavity 29-32) | 36.8 | 10.5 | 27.9 | +19.7 | 61.3 |

Batch Inspection Headroom and Scan Volume Optimization
Maximizing throughput requires balancing cavity density against reconstruction accuracy. Packing parts tightly in a build tray lowers per-unit inspection cost but increases X-ray scattering and photon starvation artifacts. Low-density polymers generally show high X-ray transmission, but when multiple components overlap along projection paths at high rotation angles, cumulative path absorption spikes.
This variation alters local signal-to-noise ratios, suppressing phase contrast fringes in dense projection angles while sharpening them in sparse ones.
These view-dependent phase fluctuations cause angular streaking during back-projection reconstruction. Optimizing multi-cavity layouts requires setting minimum clearance distances between components in the scan volume. Nesting arrangements should prevent shadow overlaps across more than fifteen percent of rotational projections, maintaining open ray paths so single-distance phase retrieval algorithms stay within their linear response regime.
Maintaining a minimum clearance of one full component width between nested polymer parts prevents mutual phase fringe shadowing and stabilizes off-axis boundary extraction routines.
Running multi-cavity scans without spatial phase calibration mapping often causes outer-ring components to register outside dimensional tolerances, forcing operators to drop throughput back down to single-part scans.
- Mount the complete multi-cavity tray onto the rotary stage, ensuring mechanical concentricity within ten micrometers of the axis center.
- Perform a preliminary three-hundred-sixty-degree projection sweep to identify maximum photon starvation angles across overlapping parts.
- Adjust detector exposure time and beam filtration so pixel counts stay between sixty and eighty percent of saturation across all projection views.
- Align spatial coordinates by matching recorded projection frames to the pre-calibrated three-dimensional cone-beam correction matrix.
- Reconstruct the volume using position-adjusted Paganin phase retrieval filters tailored to local radial coordinates.

Filter
Numerical processing reverses refractive phase shifts in projection data prior to reconstruction. Standard absorption algorithms like Filtered Back-Projection or simultaneous iterative techniques assume projection pixel values are pure line integrals of linear attenuation coefficients. Phase-contrast projections violate that core assumption because of fringe intensity spikes; running filtered back-projection directly on raw phase projections causes edge halos, amplified high-frequency noise, and inaccurate interior gray values.
Phase retrieval filters address this as a pre-processing step applied to projection radiographs before back-projection. The algorithms invert the free-space wave propagation transform, calculating the original phase shift distribution at the object plane from the intensity profile captured by the detector. Properly applied phase retrieval converts phase-enhanced edge projections back into quantitative absorption tomograms, removing boundary overshoots so automated isosurface tools can extract true dimensions.

Phase Retrieval Algorithms and Numerical Edge Restoration
Single-distance phase retrieval algorithms compute phase shifts directly from measured intensities. The approach developed by Paganin serves as the standard foundation for industrial polymer CT metrology. Paganin’s algorithm assumes the target object is homogeneous or composed of materials with proportional scaling between refractive index decrement delta and absorption index beta ~ an assumption that holds well for single-resin additive medical components with uniform bulk density.
Mathematically, the algorithm transforms projection images into Fourier space, applies a spatial low-pass filter weighted by the phase-to-absorption ratio alpha and propagation distance, and converts the result back to spatial coordinates. This low-pass action smooths high-frequency phase fringes while preserving low-frequency absorption signals, turning sharp boundary spikes into clean, step-like attenuation interfaces that fit standard reconstruction models.
Paganin and Bronnikov Filter Variations
Alternative phase retrieval formulations address geometric and material non-linearities in specialized device inspections. The Transport of Intensity Equation governs phase retrieval across arbitrary distances. While standard Paganin filtering assumes monochromatic X-rays and paraxial wave propagation, modified Bronnikov filters accommodate low-absorption objects scanned with polychromatic laboratory sources by accounting directly for the source energy spectrum and detector frequency response.
Recent single-step modified Bronnikov implementations add an empirical regularisation parameter to prevent over-smoothing sharp internal corners and micro-porosity boundaries. Choosing between Paganin, Bronnikov, or iterative phase retrieval comes down to compute resources and required processing speed: iterative solvers recover finer spatial detail, but their heavy compute overhead creates severe data bottlenecks in high-volume production lines.
| Filter Algorithm Class | Spatial Resolution Limit (μm) | Wall Thickness Error (μm) | Processing Time per Volume (s) | Sensitivity to Alpha Parameter Shift |
|---|---|---|---|---|
| Standard Absorption (No Filter) | 2.5 | +15.8 | 12 | Not Applicable |
| Single-Distance Paganin | 5.8 | +1.4 | 45 | Moderate |
| Modified Bronnikov (TIE) | 4.2 | +0.9 | 110 | High |
| Iterative Contrast-Transfer-Function | 3.1 | +0.4 | 1450 | Very High |
| Methods Note: Benchmarks evaluated across a sixty-four gigabyte tomographic volume (2048^3 voxels) reconstructed on a dual Nvidia RTX 4090 GPU workstation running CUDA-accelerated phase processing engines. | ||||

Computational Constraints in Batch Reconstruction Pipelines
Adding numerical phase retrieval to high-volume inspection pipelines generates massive compute workloads. A single scan of a sixty-four-cavity polymer batch produces thousands of high-resolution projection images, generating raw datasets between sixteen and one hundred twenty-eight gigabytes. Every individual projection radiograph must undergo phase retrieval filtering before three-dimensional back-projection reconstruction can start.
Running Fast Fourier Transforms across thousands of high-resolution frames places heavy demands on GPU memory bandwidth and compute capacity. If the processing pipeline falls behind the scan acquisition rate, volumetric data backs up in local storage queues, stalling automated material handling. Running at scale requires matching GPU hardware directly to detector frame rates so phase retrieval executes in real time during continuous production.
Data pipeline latency in phase retrieval pre-processing creates operational inspection queues when GPU memory bandwidth drops below eight hundred gigabytes per second during batch volume processing.
Quality purchasing agreements under ISO 13485 Section 7.4.2 require that software algorithms used for non-destructive product release remain under strict version control with validated parameter files, preventing operators from altering phase retrieval regularisation values without full re-validation.

Ledger
Regulatory approval for additive implantable polymer components requires strict measurement traceability. FDA twenty-one CFR Part eight twenty and ISO 13485 require non-destructive volumetric inspection protocols to establish verified measurement uncertainty bounds for all critical dimensions. Uncalibrated phase contrast edge shifts in quality release dossiers threaten compliance, making it essential for standard operating procedures to document X-ray source settings, propagation geometry, phase retrieval filter parameters, and calibration records.
During an audit of volumetric inspection records, the qualification dossier must prove that reported dimensions reflect real physical boundaries rather than phase contrast artifacts. When auditing validation dossiers for class two medical implants, undocumented phase parameters invalidate CT metrology records. A compliant workflow must tie physical phantom calibration directly to automated batch release criteria, building an unbroken chain of metrological traceability from raw projection data to final lot release.

Medical Quality Systems and Batch Release Gates
ISO 13485 quality protocols set clear requirements for validating non-destructive batch inspection. Device manufacturers must complete installation, operational, and performance qualification for all phase-contrast CT stations before using them for commercial lot release. Installation qualification verifies focal spot stability, stage rotation accuracy, and detector alignment; operational qualification confirms that phase retrieval software processes test datasets accurately without introducing numerical errors or data corruption.
Performance qualification measures long-term repeatability and reproducibility in real production settings. Protocols require scanning multi-cavity batches containing calibrated reference components across multiple shifts, operators, and ambient temperatures. Measurement system analysis must show a gauge repeatability and reproducibility ratio under ten percent of the engineering tolerance band ~ a benchmark that demands tight control over X-ray spectrum stability and phase retrieval filtering.
Audit Requirements for Volumetric CT Inspection Data
Audits by regulatory agencies or device OEMs inspect raw projection data, reconstruction logs, and software scripts. Storing 3D reconstructions alone is not enough for compliance; auditors require the specific phase retrieval filter parameters and regularisation coefficients used to extract dimensions. Systems relying on proprietary black-box software that conceals phase retrieval settings fail to demonstrate compliance with ISO 14253-1 rules for proving conformity with specifications.
Validation dossiers must archive raw projection images, phase-retrieved files, spatial calibration matrices, and final segmented volume meshes. Audit trails must log any manual operator actions, such as threshold tweaks or region-of-interest cropping. Automated logging prevents unauthorized parameter changes, ensuring every part undergoes identical, deterministic phase correction.
- Calibrated Polymer Reference Dossier complete archive of physical calibration phantom dimensions, material phase shift parameters, and tactile metrology certificates.
- Locked Phase Retrieval Parameter Log cryptographic hash record of software versioning, alpha parameters, and spatial regularisation coefficients applied to batch projections.
- Spatial Cone Beam Correction Matrix three-dimensional calibration map documenting position-dependent fringe offsets across multi-cavity build tray coordinates.
- Automated Measurement System Analysis statistical gauge repeatability and reproducibility evaluation demonstrating measurement variance below ten percent of engineering tolerance.
Capital Allocation and Inspection Throughput Arithmetic
Capital outlay for high-throughput phase-contrast CT stations must cover total ownership costs, including hardware maintenance, compute infrastructure, and validation expenses. A high-resolution micro-focus CT scanner with precision air-bearing rotary stages, high-speed detectors, and GPU reconstruction clusters costs between six hundred thousand and one million two hundred thousand dollars. System capacity hinges on total cycle time per multi-cavity batch ~ combining exposure duration, stage rotation overhead, data transfer latency, phase retrieval processing, and automated defect analysis.
To illustrate the economics, consider a manufacturer producing thirty-two thousand implantable PEEK suture anchors per month on additive platforms. Inspecting parts individually with conventional absorption CT takes eight minutes per part ~ totaling four thousand hours of inspection time per month. That workload requires six CT scanners running around the clock across three shifts, pushing capital outlay to three point six million dollars and introducing major operational complexity.
Grouping parts into thirty-two-piece batches inspected via propagation-based phase contrast CT cuts scan time to forty-five minutes per batch, including real-time Paganin GPU phase filtering. Per-unit inspection time drops to eighty-four seconds, and total monthly machine time falls to seven hundred forty-six hours. Two CT scanners operating at seventy-eight percent target utilization can handle the entire output, reducing capital expenditure from three point six million dollars down to one million two hundred thousand dollars ~ releasing two point four million dollars in capital while maintaining ISO 13485 compliance.
Deploying a multi-cavity phase-contrast inspection station requires verifying that the pre-processing pipeline handles projection arrays without dropping frames. Engineering teams need to verify that GPU phase retrieval executes within forty-five seconds per volume before signing site acceptance certificates and releasing the line for production.