Statistical Process Capability Indices for Multi Cavity Equipment Scale Up
Multi-cavity equipment scale-up requires stream-isolated Cpk calculations and nested ANOVA variance decomposition to isolate individual cavity drift.

Stream
Scaling high-cavitation production equipment transforms a basic manufacturing cell into a complex parallel network of independent manufacturing channels operating simultaneously. When expanding from a four-cavity pilot mold to a thirty-two or sixty-four cavity production tool, standard univariate statistical process capability calculations break down. Aggregating data across multiple parallel channels into a single pooled mean and standard deviation conceals vital cavity-to-cavity variation.
A combined process distribution can appear centered and normally distributed with an acceptable overall statistical capability, even while specific individual cavities consistently produce non-conforming parts. Evaluating multi-cavity equipment performance demands decomposing total observed process variance into discrete structural components.
Single-stream statistical assumptions assume that every observed part originates from an identical manufacturing state. In multi-channel equipment, total variation represents the combined output of within-cavity variation, cavity-to-cavity variation, and time-to-time batch variation. Within-cavity variation stems from inherent process noise, such as minor machine hydraulic surges or raw material lot fluctuations.
Cavity-to-cavity variation reflects permanent physical differences between tooling positions, including dimensional machining tolerances, uneven runner lengths, cooling circuit flow restrictions, or mechanical wear imbalances. Time-to-time variation represents long-term thermal drift, ambient shop-floor shifts, or resin viscosity changes across operational shifts.

Multi Cavity Parallel Variability Mechanics
High-volume production lines replicate component geometries across multiple identical tool positions to maximize output per press stroke. Single index metrics hide spatial variation. When dimensional data from all cavities are combined into one dataset, the overall variance calculation incorporates both the variation within each cavity and the variance between cavity means.
Mathematically, the overall variance equals the sum of the average within-cavity variance and the variance of the cavity means. If cavity means differ significantly, the pooled distribution widens dramatically. Thermal imbalance destroys capability.
Process engineers who rely exclusively on aggregated capability metrics run the risk of certifying unready machinery. An aggregated capability index measures total process spread against engineering drawing specification limits, but it fails to identify which physical station or tooling branch causes out-of-tolerance dimensions. Bimodal or multimodal dimensional distributions frequently emerge when cavity groups operate at different nominal means.
Bimodal distribution masking occurs when two distinct cavity clusters offset each other, creating an apparently centered overall curve that silently generates scrap at both tolerance limits.
Tooling engineers who average parallel production streams mask critical out-of-tolerance channels.
Spatial Variance across Physical Tooling Arrays
Thermal shifts across injection platens create dimensional offsets between center and outer positions. In multi-cavity injection molding, metal stamping, and automated blow molding, geometric arrangement dictates physical boundary conditions. Outer cavity positions experience higher thermal losses to ambient air than central cavity positions.
Center cavities accumulate heat, resulting in localized mold temperature elevations. Higher local mold temperatures increase plastic volumetric shrinkage, reducing final part dimensions in central positions relative to peripheral positions.
Unchecked variance multiplies unit manufacturing costs. Beyond thermal gradients, steel machining tolerances during tool fabrication introduce permanent dimensional offsets between cavity inserts. A core pin machined two hundredths of a millimeter smaller in cavity seven causes that cavity to run at a distinctly different dimensional center than adjacent positions.
Unidentified tooling deflection causes edge cavities to flash or sink while central positions meet nominal engineering drawing callouts perfectly during run trials. Transient thermal drift skews early-cycle dimensional metrics, creating false capability reads before high-cavitation tooling reaches steady-state equilibrium.
- Aggregated Sample Pooling conceals localized dimensional drift by blending wide cavity distributions into artificially smooth overall mean calculations.
- Bimodal Distribution Masking occurs when distinct cavity clusters offset each other, creating an apparently centered overall curve that secretly generates scrap at tolerance limits.
- Unidentified Tooling Deflection causes outer cavities to flex under clamp tonnage while central positions remain rigid during high-pressure injection phases.
- Transient Thermal Drift skews early-cycle dimensional metrics, generating deceptive capability reads before high-cavitation tooling achieves steady-state thermal equilibrium.
Evaluating scale-up readiness requires treating every cavity position as an independent production stream until statistical testing proves homogeneity. Homogeneity cannot be assumed based on pilot tool success. Tooling vendors routinely argue that averaging cavity outputs across the entire shot represents true machine capability because final product lots assemble from mixed inventory bins.

Gauge
Metrology system qualification underpins every statistical judgment made during production equipment expansion. Evaluating multi-cavity equipment requires measurement systems capable of isolating true cavity dimensional shifts from measurement error. Standard Gage Repeatability and Reproducibility studies designed for single-stream processes fail when applied directly to multi-cavity grids.
If measurement system variability consumes a large fraction of the specification tolerance, true cavity-to-cavity differences become obscured by measurement noise. Gauge error corrupts statistical decision boundaries.
High-cavitation equipment scale-up necessitates dedicated metrology protocols. In multi-stream environments, nested Measurement System Analysis designs separate repeatability error, operator reproducibility error, and cavity interaction effects. Standard crossed Gage R&R models assume that any operator can measure any part repeatedly.
In high-cavitation manufacturing, parts from specific cavities possess subtle, repeatable geometric signatures. Applying an improper MSA model misallocates cavity-to-cavity geometric differences into the repeatability or reproducibility error terms, artificially inflating total gauge variability.
Measurement System Discrimination across High Cavitation Tooling
Resolving subtle dimensional differences between parallel production positions demands instrumentation with high resolution relative to process tolerance spread. The number of distinct categories provided by the measurement system must exceed five for effective process control. In multi-cavity qualification, discrimination must be evaluated relative to within-cavity standard deviation rather than total process spread.
If measurement resolution is inadequate, cavity-to-cavity differences cannot be statistically distinguished from baseline equipment jitter.
Automated Optical Inspection systems and Coordinate Measuring Machines serve as primary verification tools during scale-up. CMM measurement cycle times often present a operational bottleneck during qualification trials. Measuring thirty-two dimensions across sixty-four cavities yields over two thousand data points per press shot.
To maintain reasonable qualification timelines, metrology sampling strategies must balance measurement precision against cycle duration without introducing sampling bias.
The ISO 22514-8 metrology specification mandates isolating measurement error from stream-to-stream variance before declaring production equipment capable.

Metrology Isolation in Multi Stream Sampling
Data collection across expanded production lines involves nested sampling strategies to isolate instrument variation from physical part variation. Fixture wear and tactile probe tip deflection introduce systematic measurement drift over extended measuring cycles. When measuring complete shots from high-cavitation tooling, parts must be loaded into automated measuring fixtures in randomized sequences.
Non-randomized measurement sequences risk confounding thermal tool warming with metrology fixture heating or CMM thermal expansion.
| Evaluation Protocol | Variance Component Isolation | Sample Execution Burden | Risk of Masking Cavity Imbalance | Suitability for Equipment Scale-Up Sign-Off |
|---|---|---|---|---|
| Crossed Gage R&R | Combines operator and part interactions | Moderate sample count required | High risk of misclassifying cavity bias as operator error | Unsuitable for multi-stream equipment qualification |
| Nested ANOVA Gage R&R | Isolates instrument, operator, cavity, and cycle variance | High sample count required | Low risk due to explicit hierarchical variance partitioning | Mandatory for initial multi-cavity tooling acceptance |
| Multi-Sensor AOI Metrology | Isolates optical distortion, camera calibration, and cavity variance | Low sample count due to parallel high-speed scanning | Moderate risk if optical distortion gradients exist across field | Recommended for continuous high-speed production line gating |
Process drift narrows effective tolerance bounds. Calibration protocols must verify optical linearity across the full field of view when using wide-field vision systems. Edge distortion on large optical sensors can manifest as false dimensional variations in outer tooling cavities.
Metrology systems with insufficient discrimination index values inflate apparent cavity-to-cavity variance and force unnecessary physical tooling modifications.
Arithmetic
Quantifying multi-channel equipment capability demands statistical models capable of evaluating multi-stream data distributions. Traditional univariate process capability indices calculate process capability based on the assumption of a single normally distributed population. For multi-cavity equipment, calculating capability requires adhering to multi-stream frameworks defined in standards such as ISO 22514-8 and AIAG SPC reference manuals.
These standards provide mathematical algorithms to compute overall process capability while identifying individual stream non-conformities.
The calculation framework divides overall capability into stream-specific capability and combined process performance. Individual cavity process capability indices evaluate how each separate cavity aligns with engineering specification limits. Cavity nine sets the line rate.
The minimum individual capability index across all cavities represents the true upper bound of process capability. If any single cavity fails capability requirements, the entire multi-cavity machine fails qualification, regardless of how well the remaining cavities perform.

ISO 22514-8 Multi-Stream Capability Formulations
International standards establish distinct mathematical frameworks for multi-channel production lines. Total standard deviation is decomposed using Analysis of Variance equations. Within-cavity standard deviation is calculated by pooling the sample variances of each cavity position:
S_within = sqrt( sum(S_i^2) / k )
where S_i represents the sample standard deviation of cavity i, and k represents the total number of cavities. The between-cavity standard deviation quantifies the dispersion of cavity means around the grand mean:
S_between = sqrt( max( 0, ( sum((X_bar_i – X_double_bar)^2) / (k – 1) ) – (S_within^2 / n) ) )
where X_bar_i is the sample mean of cavity i, X_double_bar is the grand mean of all cavities, and n is the subgroup sample size per cavity. The total process standard deviation equals:
S_total = sqrt( S_within^2 + S_between^2 )
Using S_total yields the total process performance index, P_pk. Evaluating potential process capability, C_pk, requires isolating S_within and calculating individual capability for each cavity stream:
C_pk_i = min( (USL – X_bar_i) / (3 S_within), (X_bar_i – LSL) / (3 S_within) )
The overall multi-stream capability index, C_pk_min, equals the minimum C_pk_i value found across all k cavities.

Which Capability Algorithm Prevents False Qualification Signals?
Selecting an appropriate capability equation determines whether qualification trials reflect physical reality or statistical artifacts. Consider a concrete scale-up scenario. A company evaluates a 4-cavity pilot mold expanding to a 32-cavity high-volume tool for a critical connector housing.
The upper specification limit is 12.15 mm, and the lower specification limit is 11.85 mm, establishing a total tolerance band of 0.30 mm around a nominal target of 12.00 mm.
During pilot trials on the 4-cavity tool, the within-cavity standard deviation S_within measures 0.012 mm, and the maximum difference between cavity means is 0.015 mm. The calculated C_pk_min across the 4 cavities equals 1.82, well above the 1.67 pilot qualification threshold. Pilot capability guarantees no production success.
When scaled up to the 32-cavity production tool, hot runner thermal gradients and hydraulic flow imbalances alter dimensional distribution. Sampling 50 parts per cavity yields a within-cavity standard deviation S_within of 0.014 mm. However, cavity means range from 11.91 mm at peripheral locations to 12.11 mm at central locations, yielding a cavity mean spread of 0.068 mm.
S_between calculates to 0.021 mm, resulting in a total process standard deviation S_total of 0.0252 mm.
Evaluating this scaled tool using aggregated univariate software pools all 1,600 measurement points into a single dataset with a grand mean of 12.01 mm and an overall standard deviation of 0.0252 mm. The aggregated univariate formula calculates an overall process capability index of:
C_pk_aggregated = (12.15 – 12.01) / (3 0.0252) = 1.85 / 0.0756 = 1.85
This aggregated result gives the false impression that the 32-cavity tool easily passed scale-up requirements. Applying stream-isolated multi-stream arithmetic reveals the true process condition. Calculating capability for Cavity 27, which runs at an isolated mean of 12.11 mm with an internal S_within of 0.015 mm, yields:
C_pk_cavity_27 = (12.15 – 12.11) / (3 0.015) = 0.04 / 0.045 = 0.89
Cavity 27 is severely out of capability and produces non-conforming parts. The aggregated metric hid this failure by averaging Cavity 27 with Cavity 4, which ran at 11.91 mm. Evaluating multi-stream capability via aggregated univariate calculations generates dangerous false qualification signals.
A thirty-two cavity tool exhibiting an aggregated statistical index of 1.42 contains individual cavity streams operating below 0.91 when manifold temperature imbalance exceeds four degrees Celsius.
| Metric Designation | Mathematical Formulation | Primary Variance Component Captured | Qualification Risk Level | Equipment Scale-Up Gate Decision |
|---|---|---|---|---|
| Aggregated Univariate C_pk | (USL – X_double_bar) / (3 S_pooled) | Blends within and between variance into single pool | High risk of false acceptances due to cavity masking | Reject as sign-off criteria; conceals single-stream defects |
| Multi-Stream Potential C_p | (USL – LSL) / (6 S_within) | Pure within-cavity process potential noise | Low risk for checking basic mechanical repeatability | Accept for assessing machine hydraulic stability only |
| Minimum Stream Capability C_pk_min | min( (USL – X_bar_i) / (3 S_within) ) | Worst-performing individual cavity dimensional offset | Zero false acceptances; isolates exact defective station | Mandatory gate metric for production equipment sign-off |
| Total Process Performance P_pk | (USL – X_double_bar) / (3 S_total) | Combined impact of centering, spread, and cavity shift | Moderate risk if cavity means are highly asymmetrical | Accept for initial long-term inventory production estimates |
- Measure fifty consecutive cycles across every cavity position under steady-state operating conditions to generate a complete matrix of raw dimensional data.
- Perform a single-factor Analysis of Variance to separate total observed variance into within-cavity random noise and between-cavity structural shifts.
- Calculate individual capability indices for each specific cavity position using its local mean and within-cavity standard deviation.
- Compare the lowest single-cavity capability value against contractually mandated acceptance thresholds before authorizing equipment line transfer.
Subgroup size dictates statistical resolution power. Applying aggregated univariate algorithms during production equipment scale-up leads to premature commercial sign-off, resulting in unbudgeted secondary sorting operations and severe warranty return liabilities.

Mould
Hardware performance during equipment scaling relies on maintaining fluid dynamic and thermal equilibrium across every forming location. Scaling up tooling from pilot units to high-cavitation production configurations alters mechanical and thermal dynamics. In injection molding, die casting, and glass forming, doubling or quadrupling the cavity count increases the complexity of the hot runner or melt delivery manifold.
Physical distance from the central machine inlet to outer cavities increases pressure drops and residence time variability. Balanced runner layouts stabilize cavity pressure.
Physical scale-up effects are not purely linear. Flow front velocity variations between cavities generate proportional variations in shear rate, polymer chain orientation, and localized cooling rates. Melt temperature variations alter part dimensions.
Peripheral cavities fed by longer manifold channels experience higher pressure drops, resulting in lower peak cavity pressures and reduced volumetric pack. These physical differences translate directly into spatial variation in part weight, volumetric shrinkage, and critical dimensions across the tooling face.
Thermal and Rheological Dynamics in Scaled Tooling
Fluid pressure drops inside runner channels alter resin flow speeds across outer cavity locations. Manifold design must balance both flow distance and shear history across every channel branch. Naturally balanced runner geometries deliver identical path lengths and channel diameters to all cavities.
However, geometrically balanced runners in high-cavitation tools require complex three-dimensional layouts that introduce thermal management challenges inside the mold frame.
Hot runner heating element failures or uneven cartridge heater density distribution produce temperature gradients across the manifold block. A localized ten-degree Celsius temperature elevation reduces melt viscosity, causing that specific cavity group to fill faster and pack denser than cooler adjacent cavities. Tool deflection distorts outer cavity dimensions.
Cavity pressure transducers provide real-time pressure curves during injection, allowing engineers to diagnose hydraulic imbalance before collecting parts for capability analysis.
High-cavitation injection tooling alters shear rates and melt temperatures across peripheral runner branches.
Structural Deflection and Clamp Pressure Distribution
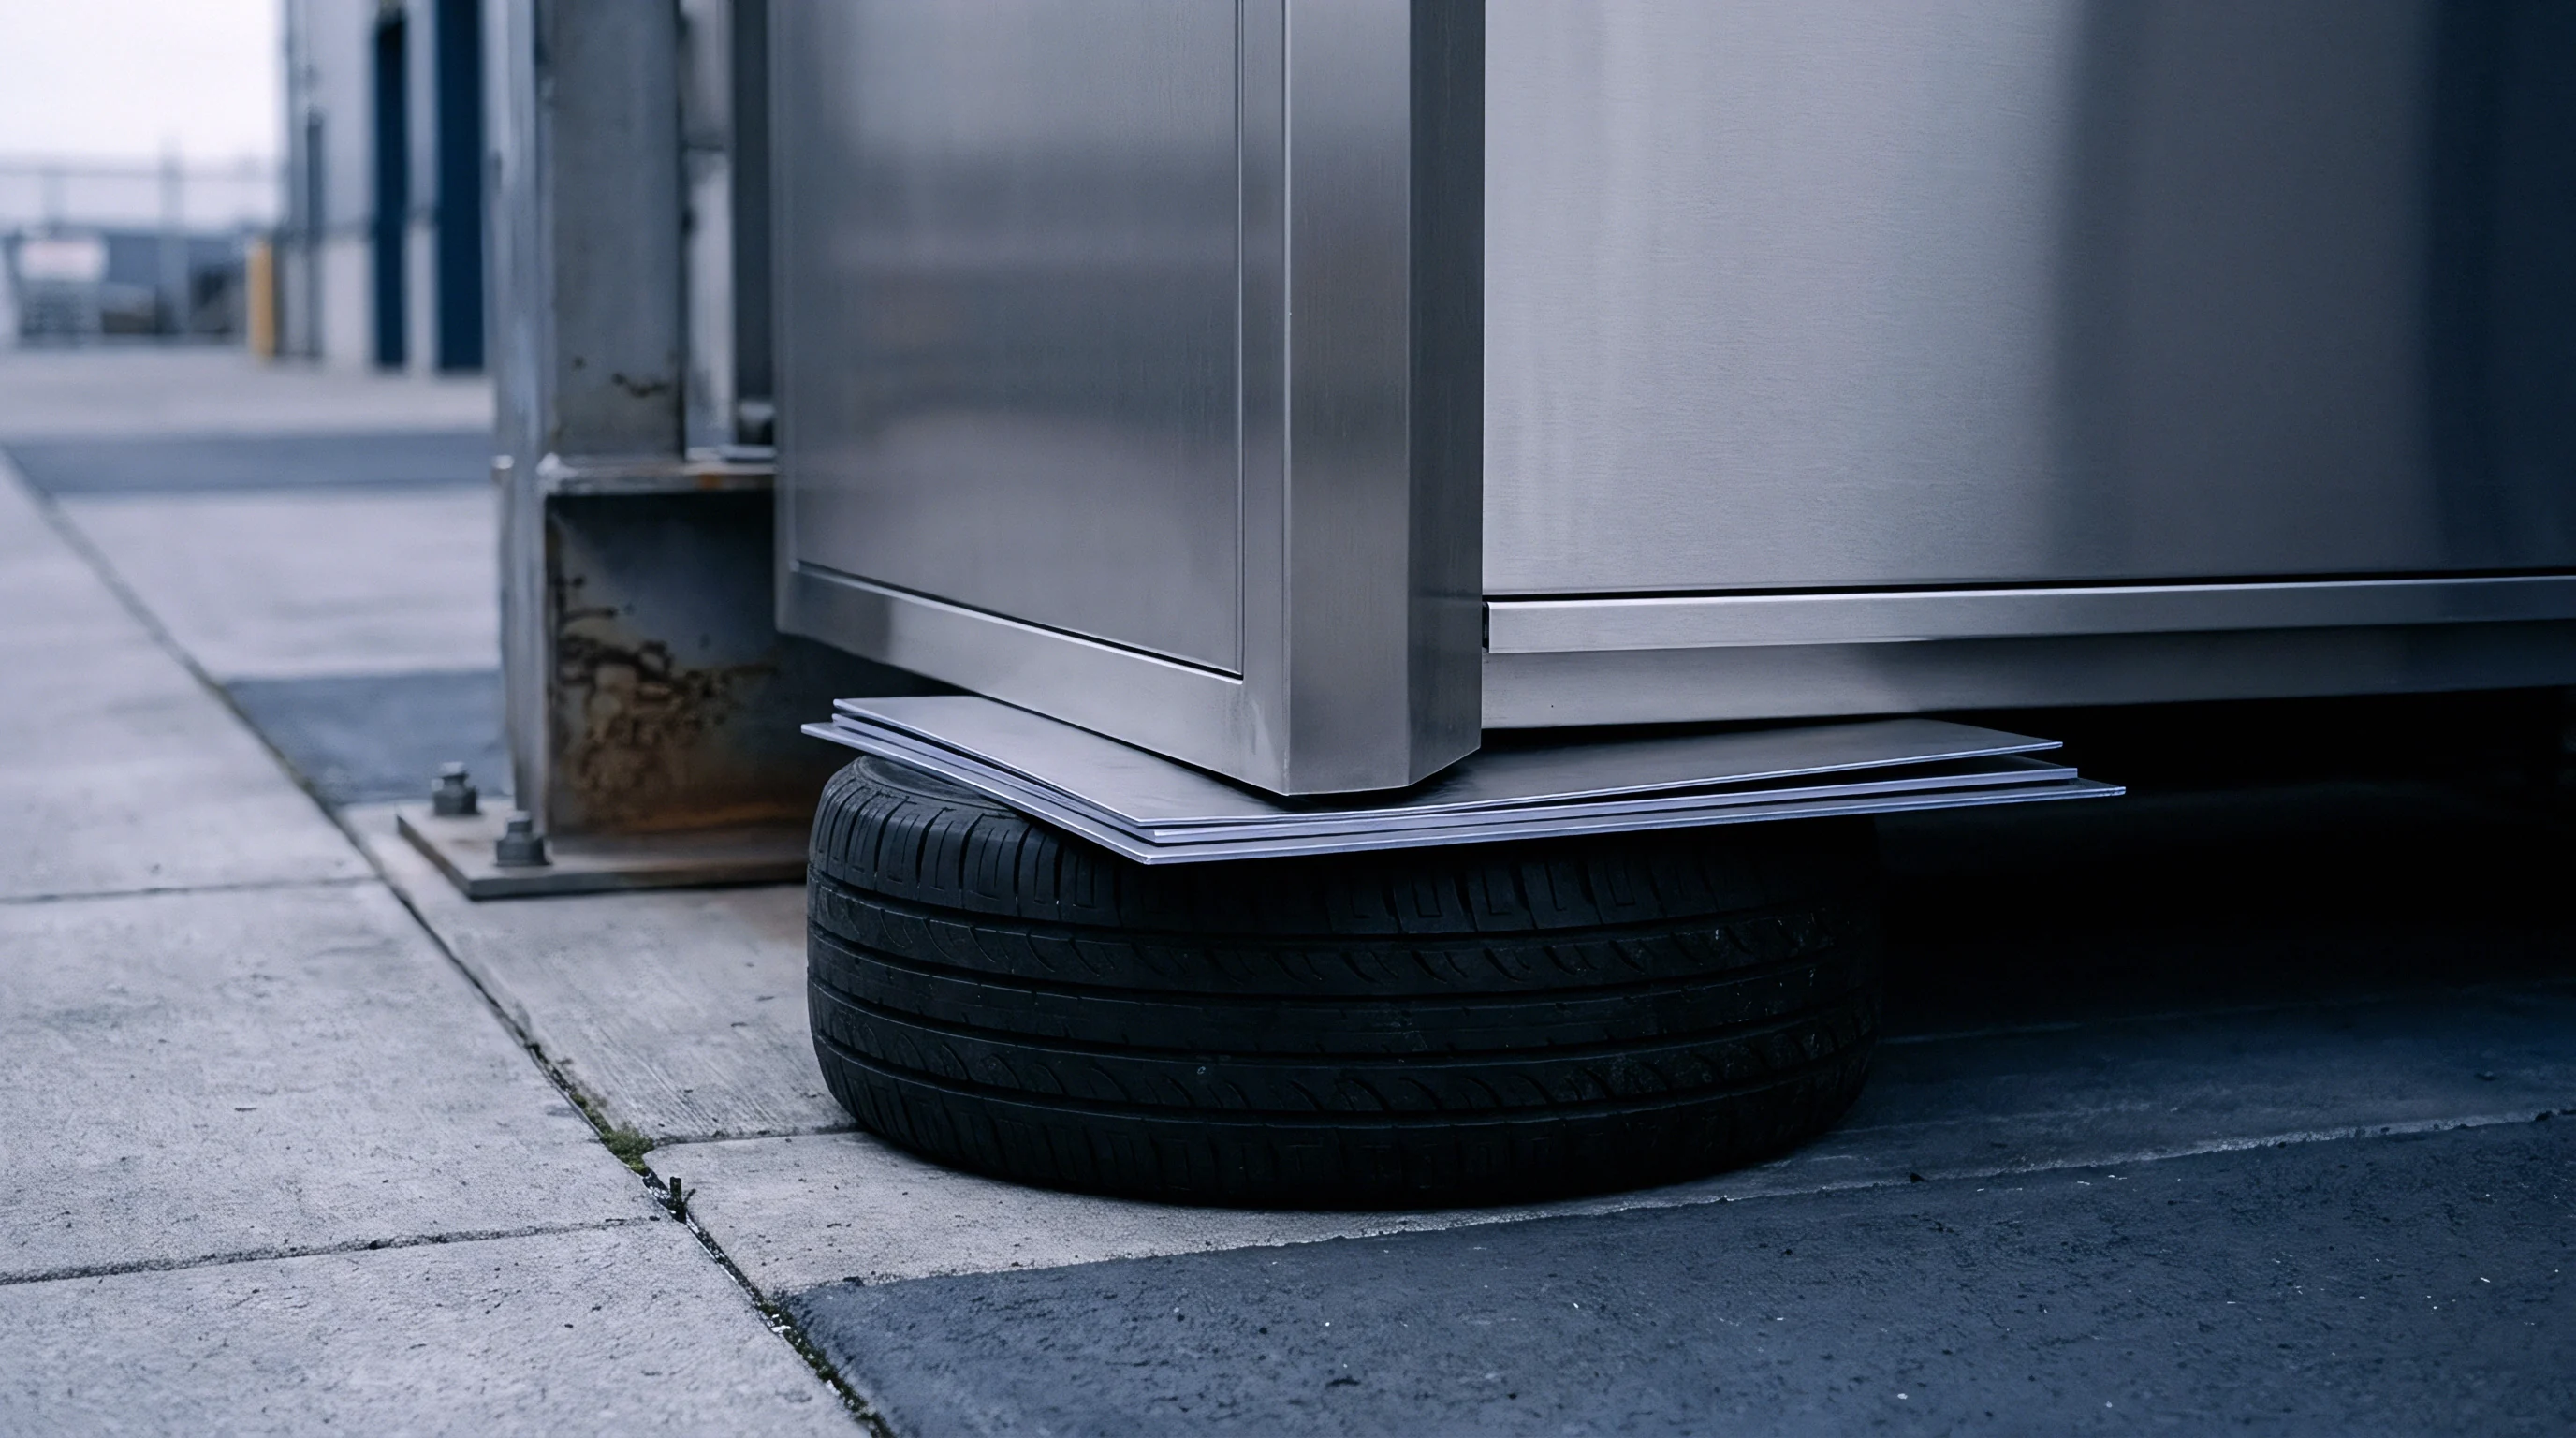
High tonnage hydraulic forces distort machine platens during full-pressure injection phases. Machine platens flex slightly under full clamping force, creating uneven parting line clamping pressure across large mold frames. Central cavity positions experience higher effective clamping pressure than outer corners.
Inadequate clamping pressure at corner locations allows micro-deflection of the mold faces, causing parting line flash and increased wall thickness dimensions in outer cavities.
| Tooling Cavitation Tier | Hot Runner Balance Limit | Platen Deflection Boundary | Target Within-Cavity C_pk | Scale-Up Approval Threshold |
|---|---|---|---|---|
| 4-Cavity Pilot Tool | Max 2% pressure drop variance | Under 0.010 mm center deflection | Greater than 2.00 | C_pk_min equal to or greater than 1.67 |
| 16-Cavity Bridge Tool | Max 4% pressure drop variance | Under 0.020 mm center deflection | Greater than 1.80 | C_pk_min equal to or greater than 1.50 |
| 64-Cavity Production Tool | Max 7% pressure drop variance | Under 0.035 mm center deflection | Greater than 1.67 | C_pk_min equal to or greater than 1.33 |
Platen deflection issues become more pronounced when small tools are run on oversized presses, or large high-cavitation tools operate near the machine’s maximum tie-bar distance limit. Steel deformation under cyclic loading accelerates wear on mechanical alignment elements like leader pins and interlocking taper blocks. Mechanical wear systematically widens cavity-to-cavity dimensional dispersion over time, steadily eroding initial statistical capability gains.
The degree to which active cavity pressure control valves can dynamically compensate for asymmetric thermal expansion in sixty-four cavity frames remains an open operational question across high-speed packaging applications.


Ledger
Commercial equipment acceptance ties financial progress payments directly to statistical proof of stability and capacity. Scaling up multi-cavity equipment represents a substantial capital expenditure. Equipment purchase contracts must explicitly define the statistical models, sampling protocols, and capability thresholds required for Factory Acceptance Testing and Site Acceptance Testing.
Relying on vague capability clauses invites disputes when machinery achieves target output rates but fails multi-stream quality standards.
Procurement documents must mandate stream-isolated capability proofs prior to final equipment sign-off. Capital release requires isolated capability proofs. Contracts that specify a generic capability index of 1.67 without defining calculation methods leave room for suppliers to apply aggregated univariate calculations.
Machinery builders can present aggregated data that meets contract specifications while individual cavities produce high scrap rates. Contract terms enforce stream isolation.
Contractual Qualification Gates and Capital Release
Procurement documents establish binding performance criteria that govern capital equipment milestone releases. Stage-gate capital release structures protect buyers from inheriting unready production lines. Equipment contracts should divide capital release into distinct, measurable stages: initial dry-cycle verification, pilot tool single-cavity run, full-cavitation short-term capability trial, and extended steady-state production demonstration.
Final sign-off requires proving capability under realistic production conditions. Suppliers must demonstrate that all cavities simultaneously achieve minimum capability thresholds during continuous runs using production-grade raw materials. Capital release gates must prohibit releasing final milestone payments until every individual cavity meets the contractual minimum capability index floor.

Equipment Procurement Capability Specifications
Purchasing agreements require explicit statistical index definitions to prevent post-installation disputes regarding machinery performance. Equipment qualification contracts should specify minimum C_pk_min values, maximum allowable cavity mean spread, metrology Gage R&R thresholds, and standardized sampling run lengths.
- Stream Isolated Capability Guarantees tie equipment vendor milestone payments directly to individual cavity performance indices rather than aggregated platen averages.
- Steady State Thermal Benchmarks mandate continuous thermal imaging validation across hot runner manifolds prior to initiating statistical sampling runs.
- Automated Gauge Integration Mandates require fully calibrated inline optical scanning systems to verify dimensional stability without manual sampling bias.
- Defect Lot Rejection Thresholds establish automatic batch rejection protocols whenever any single cavity stream drops below agreed minimum process capability bounds.
Defining clear statistical acceptance gates shifts technical risk back to the equipment manufacturer. Incorporating ISO 22514-8 Annex B qualification criteria into final machinery purchase orders shifts financial liability for secondary cavity re-tooling entirely onto the equipment manufacturer prior to final sign-off.