Non-Linear Melt Viscosity Calibration in Polymer Processing Operations
Non-linear viscosity calibration requires multi-point shear rheometry and Cross model fitting to prevent extreme die sizing and molding pressure errors.

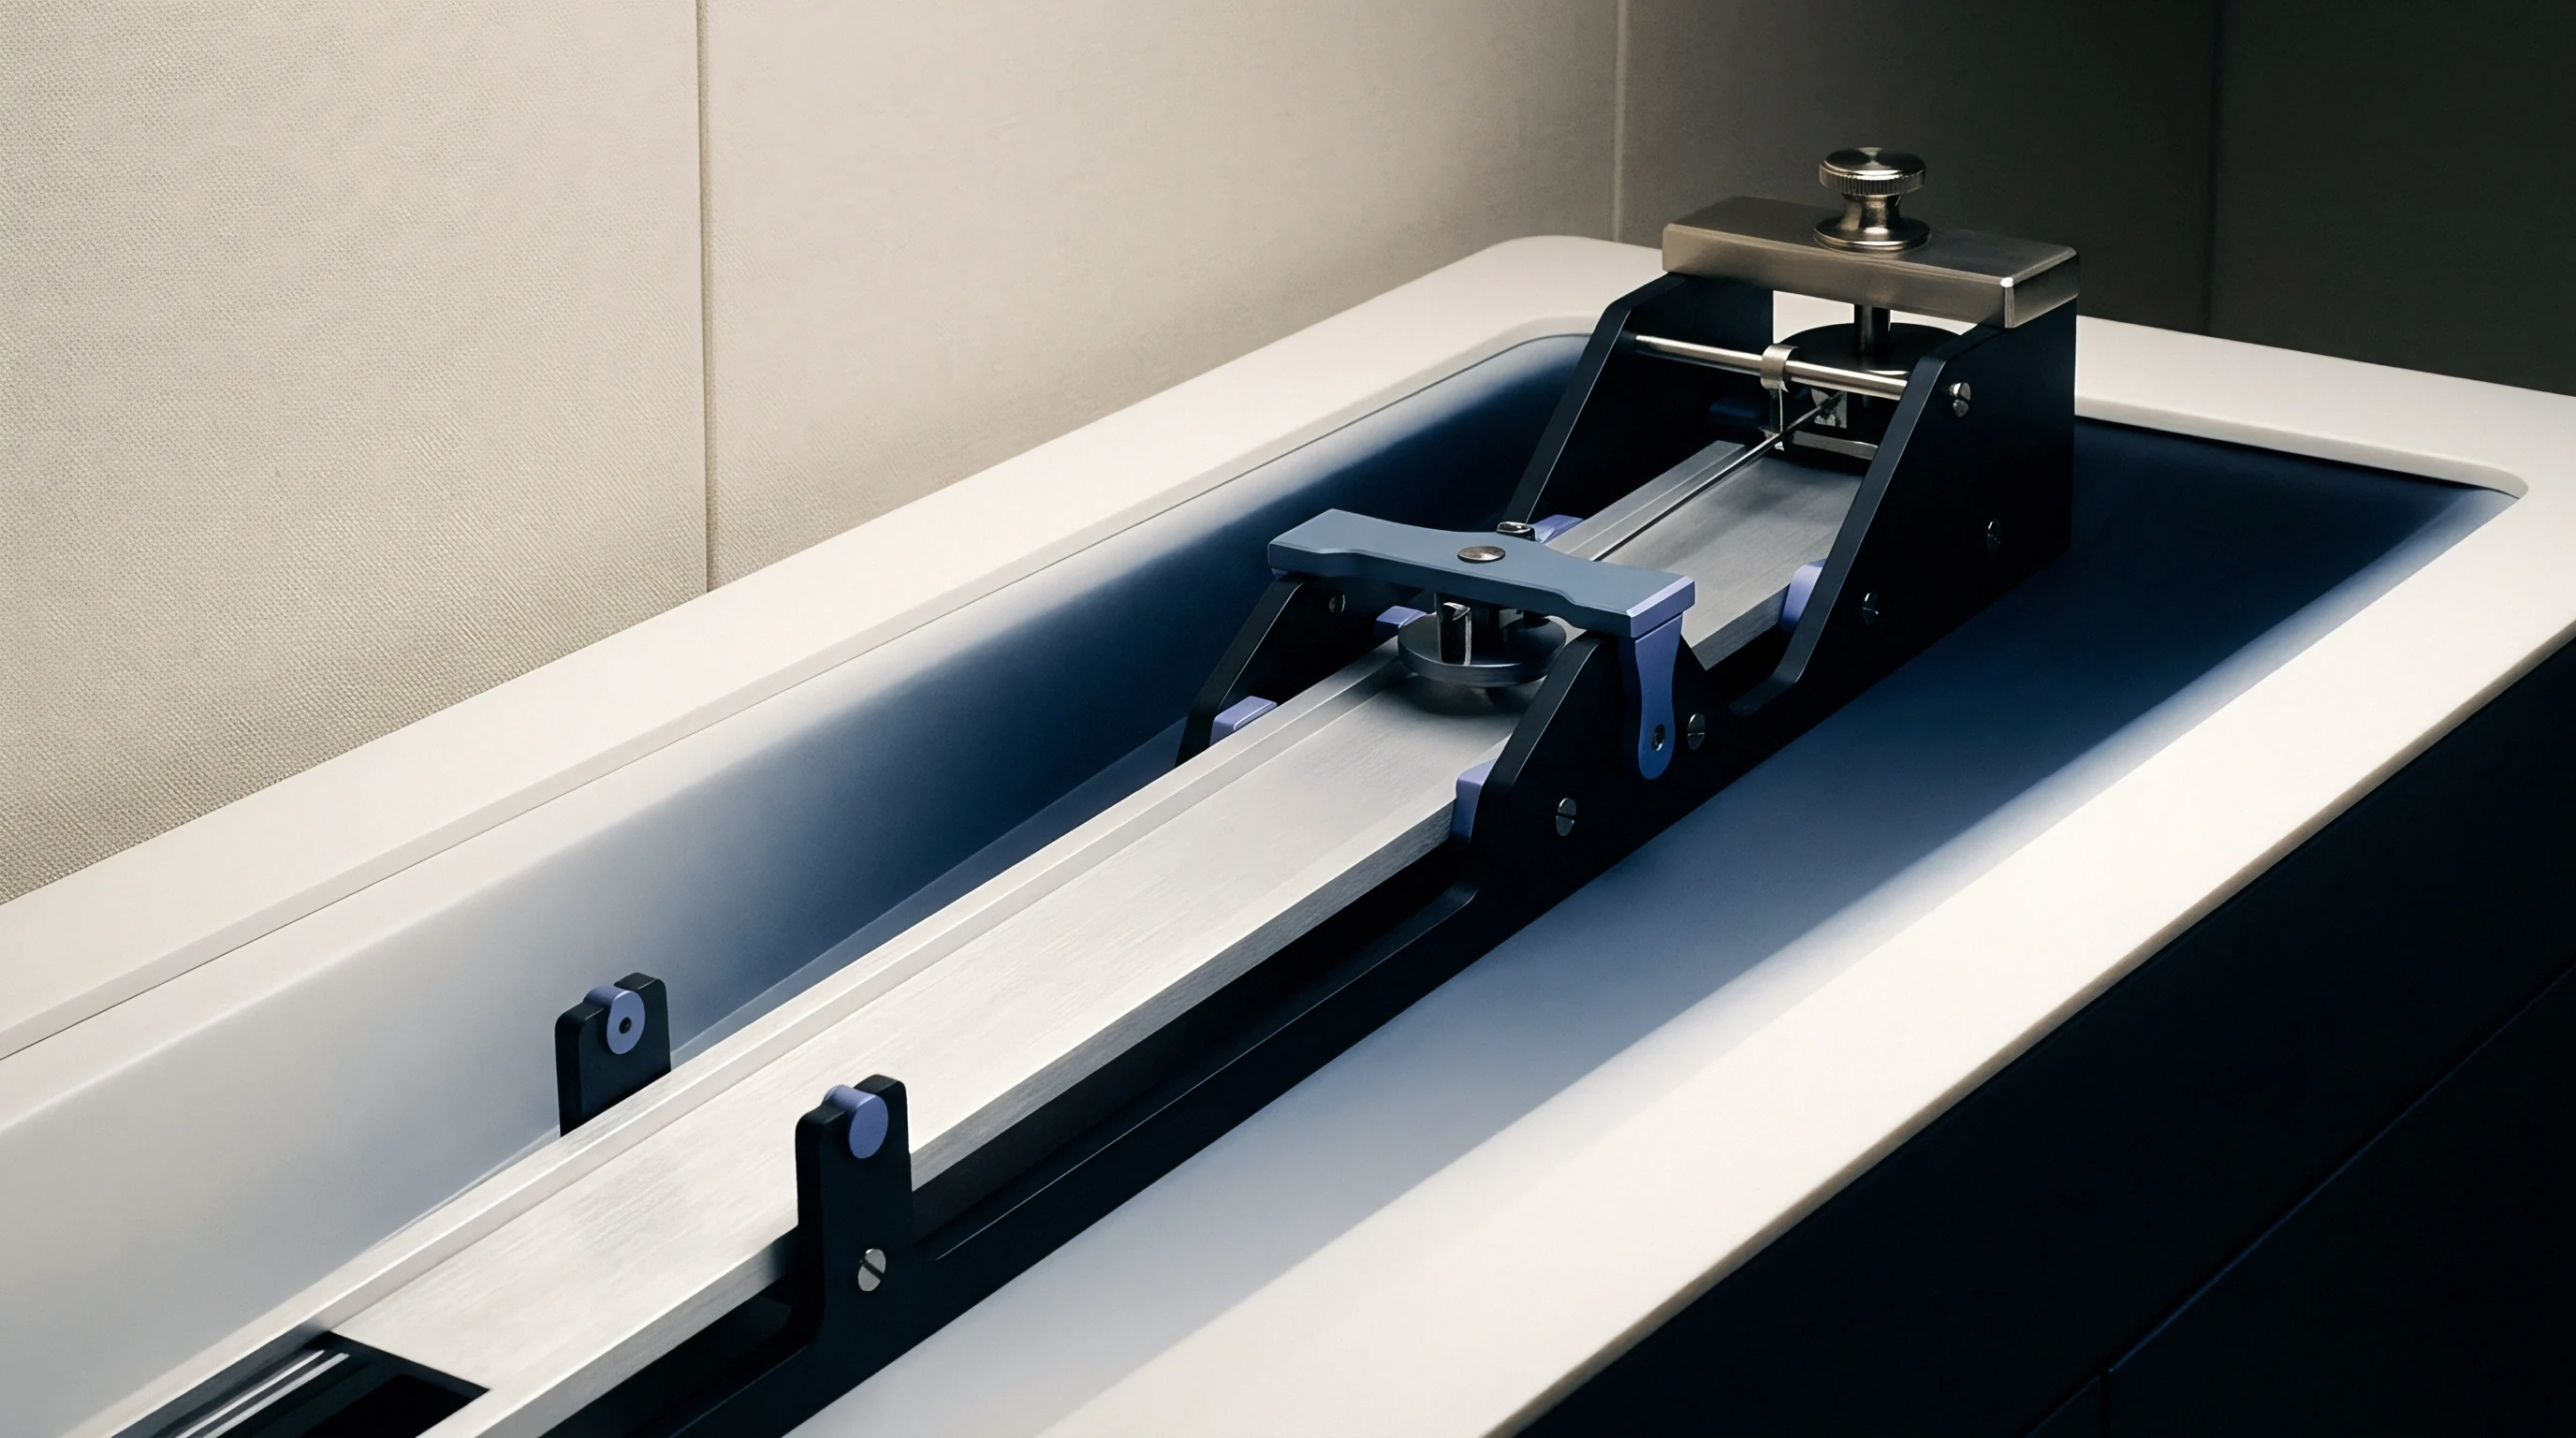
Capillary
Rheometric characterization of polymer melts at high shear rates requires rigorous pressure loss corrections to isolate true wall shear stress. Industrial extrusion dies and injection nozzles run between one thousand and one hundred thousand inverse seconds. Standard linear shear models break down across these deformation rates, where chain disentanglement triggers non-linear viscosity collapse.
Accurate laboratory calibration relies on high-pressure capillary rheometers fitted with precision transducers immediately upstream of the die entrance.

Wall Shear Corrections and Pressure Losses
Raw pressure readings at the die exit include dynamic entrance and exit losses. As the melt converges from the barrel into a narrow channel bore, extensional flow introduces substantial entrance pressure drops. The Bagley correction isolates these converging losses by testing samples across at least three dies of identical diameter but varying length-to-diameter ratios.
Plotting total measured pressure drop against die length-to-diameter ratio yields a linear relationship. Extrapolating this line to a length-to-diameter ratio of zero gives the entrance pressure loss, which is then subtracted from total measured pressure to determine the fully developed wall shear stress inside the capillary channel.
Capillary length to diameter ratios below 16 introduce entrance pressure errors exceeding 22 percent in high-density polyethylene melts.
Ignoring Bagley corrections leads to significant overestimation of melt viscosity, prompting engineers to over-design hydraulic drive systems and miscalculate production tolerances. Non-linear calibration curves require clean separation of shear and extensional pressure components.

Rabinowitsch Flow Profile Adjustment
Non-Newtonian velocity profiles deviate from classic parabolic distributions during high-rate extrusion. Newtonian fluids display a parabolic profile where wall shear rate scales directly with volumetric throughput, but shear-thinning polymer melts flatten in the core and steepen at the channel wall. The Rabinowitsch correction calculates true wall shear rate from the apparent rate and the local derivative of shear stress.
Determining the true wall shear rate requires evaluating the slope of log shear stress versus log apparent shear rate. High-rate viscometric testing encounters several well-defined physical limits:
- Capillary Aspect Ratio Errors arise when testing dies feature length-to-diameter ratios below 16, preventing full shear profile development and inflating apparent viscosity readings.
- Pressure Transducer Recess Effects occur when flush-mounted transducers sit inside dead-leg cavities, creating localized stagnant zones that lag during pressure transient steps.
- Thermal Dissipation Traps occur when shear heating inside thin capillaries raises local fluid temperatures by ten degrees Celsius, causing artificial viscosity drops at high shear rates.
- Wall Slip Threshold Delaminations emerge when critical wall shear stresses exceed one hundred kilopascals, causing boundary slip that skews calculated wall shear rates.
Operating high-shear extrusion tooling without Bagley and Rabinowitsch corrections skews mold cavity pressure calculations, leading to localized flash, short shots, and expensive tooling modifications.


Algorithm
Numerical simulation tools require mathematical models that convert multi-point viscometric data into executive flow parameters. Linear power-law models hold up only across narrow shear rate bands of one or two orders of magnitude, whereas factory operations span four to five orders ~ from slow manifold flow to extreme die gate shear. Generalized Newtonian models such as Cross and Carreau-Yasuda capture both the low-shear Newtonian plateau and the high-shear power-law regime.

Cross and Carreau Model Fitting
Zero-shear viscosity defines the low-deformation plateau essential for calculating pressure drops inside extrusion dies. The Cross model relates viscosity to shear rate through this zero-shear baseline, a characteristic relaxation time constant, and a power-law exponent. Solvers fit these parameters to laboratory viscosity measurements using Levenberg-Marquardt non-linear regression.
Calibration accuracy depends directly on the breadth of experimental shear rate data supplied to the solver. Fitting routines must incorporate low-shear rotational rheometry alongside high-shear capillary data to anchor zero-shear plateau calculations reliably.
The table below summarizes standard calibration parameters and acceptance windows for non-linear viscosity fitting across common thermoplastic processing grades.
| Polymer Family | Model Type | Zero-Shear Viscosity (Pa-s) | Relaxation Time (s) | Power-Law Exponent | Fit Residual Tolerance (%) |
|---|---|---|---|---|---|
| Cross Model | 8,500 – 14,000 | 0.035 – 0.062 | 0.28 – 0.34 | < 2.5 | |
| Carreau-Yasuda | 3,200 – 6,800 | 0.012 – 0.028 | 0.32 – 0.38 | < 1.8 | |
| Cross Model | 1,100 – 2,400 | 0.002 – 0.008 | 0.62 – 0.68 | < 1.2 | |
| Cross-WMS | 12,000 – 22,000 | 0.085 – 0.140 | 0.22 – 0.28 | < 3.0 | |
| Data gathered at standard reference processing temperatures per ISO 11443 testing protocols. Residuals calculated via non-linear least squares optimization. | |||||
Can Single Point Index Metrics Predict Non-Linear Flow?
Melt flow rate testing measures raw mass output through an orifice under fixed deadweight load, capturing only an isolated point at low shear rates between one and ten inverse seconds. Production tooling operates three orders of magnitude faster. Two resin lots showing identical melt flow indices of two grams per ten minutes can diverge by thirty percent in shear viscosity inside an injection gate, causing severe filling imbalances across multi-cavity molds.

Worked Calibration Sensitivity Calculation
Consider a lot of high-density polyethylene processing through an extrusion die at ten thousand inverse seconds. A linear power-law model calibrated between one hundred and one thousand inverse seconds yields an index exponent of 0.35 and a consistency index of 12,000 Pascal-seconds, projecting an effective viscosity of 47.8 Pascal-seconds at ten thousand inverse seconds. Laboratory capillary rheometry fitted to a Cross model on the same lot yields a zero-shear viscosity of 8,500 Pascal-seconds, a relaxation time of 0.042 seconds, and an exponent of 0.32, predicting an actual effective viscosity of 31.2 Pascal-seconds.
The linear extrapolation overestimates viscosity by 53.2 percent, prompting tooling engineers to specify oversized injection units and excessive clamp tonnages.
- Sample three representative batch lots from production stock across different synthesis lots.
- Condition polymer pellets at eighty degrees Celsius under full vacuum for four hours to eliminate moisture.
- Execute rotational rheometry from 0.01 to 100 radians per second to isolate zero-shear viscosity.
- Execute capillary rheometry from 100 to 20,000 inverse seconds using dual dies to generate Bagley corrections.
- Apply Rabinowitsch flow profile adjustments to corrected capillary shear stress data.
- Input combined data sets into a Levenberg-Marquardt solver to calculate non-linear Cross model parameters.
A single melt flow index value is often treated as sufficient quality assurance, though it fails to reflect material behavior under high-speed processing conditions.

Barrel
Extrusion screws generate substantial viscous dissipation that elevates core melt temperatures well beyond external zone setpoints. Non-linear viscosity calculations require close thermal coupling because polymer melt viscosity depends exponentially on local temperature. High shear rates inside narrow flights convert mechanical shaft work into thermal energy, lowering melt viscosity and shifting operating curves during continuous production.

Thermal Dissipation and Temperature Coupling
High-viscosity polymers convert shaft power directly into thermal energy during aggressive processing. Calibration routines model this coupling using the Williams-Landel-Ferry equation for amorphous polymers or the Arrhenius relationship for semi-crystalline resins, scaling zero-shear viscosity and relaxation time constants across processing zones.
Elevating screw rotational speed past the shear-thinning transition increases viscous self-heating faster than external barrel cooling jackets can remove thermal energy.
Calibration curves that omit thermal sensitivity cause flow simulations to over-predict pressure drops by wide margins. Injected core melts experience shear heating inside die channels, causing localized viscosity drops that alter wall shear stresses.
| Screw Speed (RPM) | Apparent Wall Shear Rate (1/s) | Core Melt Temperature Rise (°C) | Uncorrected Viscosity Error (%) | Corrected Pressure Drop (MPa) |
|---|---|---|---|---|
| 30 | 1,200 | 2.4 | + 4.1 | 18.2 |
| 60 | 2,400 | 6.8 | + 11.5 | 22.4 |
| 90 | 3,600 | 12.5 | + 19.8 | 25.1 |
| 120 | 4,800 | 19.2 | + 28.4 | 27.3 |

Screw Speed and Shear Rate Bounds
Rotational frequency sets the local velocity gradients within screw flights. Operating past shear-thinning inflection points yields diminishing returns in head pressure generation while accelerating melt degradation. Line audits require systematic checks of operating conditions:
- Thermal Equilibrium Verification requires steady-state melt thermocouple stability within 0.5 degrees Celsius across thirty minutes before recording calibration pressures.
- Flight Shear Rate Alignment confirms local screw channel velocity gradients fall within the validated non-linear calibration range of the laboratory rheometer.
- Pressure Transducer Span Audit verifies dynamic melt transducers operate between thirty and eighty percent of full-scale rating during peak screw torque loading.
- Backpressure Compensation Adjustments isolate head pressure shifts caused by screen pack blinding from true shear-thinning viscosity alterations.
Compliance with ASTM D3835 Clause 8.2 requires reporting the exact melt temperature within the capillary die to prevent uncorrected shear-heating errors from invalidating production viscosity curves.


Swell
Elastic recovery at the exit of an extrusion die causes immediate dimensional expansion as stretched polymer chains contract upon leaving the channel walls. Non-linear viscosity calibration must account for viscoelastic first normal stress differences to predict final part cross-sections accurately.

First Normal Stress Difference Mechanics
Polymer chains deform and align along streamlines during high-shear transit. Normal stresses develop perpendicular to the primary flow vector as elastic energy accumulates within the entangled melt structure, driving higher swelling ratios at the die exit as shear rates rise.
Dies featuring short land lengths prevent elastic stresses from relaxing, amplifying extrudate swell upon exit. Calibration algorithms integrate normal stress metrics alongside shear viscosity to predict profile dimensions under variable line speeds.
Non-compliance with ISO 11443 entrance correction procedures voids die swelling tolerances established in OEM tooling supply agreements.
| Land Length to Diameter Ratio | Die Residence Time (ms) | Measured Swell Ratio (D/D0) | First Normal Stress (kPa) | Surface Quality Status |
|---|---|---|---|---|
| 4 | 2.1 | 1.68 | 185 | Gross Melt Fracture |
| 8 | 4.2 | 1.45 | 142 | Sharkskin Defect |
| 12 | 6.3 | 1.28 | 98 | Acceptable Profile |
| 20 | 10.5 | 1.14 | 52 | Smooth Optical Surface |

Defect Boundaries and Melt Fracture Thresholds
Surface sharkskin appears when wall shear stresses exceed two hundred kilopascals in polyolefin grades. Increasing shear rates past critical thresholds induces stick-slip flow, causing periodic pressure oscillations and severe structural extrudate distortion. Non-linear calibration dossiers establish processing envelopes bounded by sharkskin onset at high shear rates and gravitational sag at low rates.
- Capillary Entrance Angle Specifications mandate a entry angle between sixty and ninety degrees to streamline polymer chain orientation.
- Die Land Length Bounds specify a minimum length-to-diameter ratio of 16 to relax normal stresses before extrudate release into atmosphere.
- Barrel Temperature Band Limits regulate channel wall temperatures within three degrees Celsius of target to prevent wall slip transitions.
- Fluoropolymer Additive Dosages fix processing aid levels at 500 parts per million to suppress surface sharkskin at elevated throughputs.
Tooling dies designed without accounting for elastic swell force extrudates outside dimensional specifications, regardless of downstream puller speed adjustments.


Dossier
Material qualification records capture batch variance before full production sign-off. Quality management systems enforce non-linear viscosity tracking across raw material lots to prevent unexpected processing failures on production lines.

Quality Verification and Lot Acceptance
Incoming inspection relies on rheometric testing windows rather than standard melt flow index values. Receiving procedures log zero-shear viscosity, transition relaxation time, and power-law slope into statistical process control databases. Divergent power-law slopes indicate altered molecular weight distributions that cause filling imbalances during automated injection cycles.
Batch-to-batch molecular weight distribution variations alter non-linear viscosity power-law slopes even when melt flow index numbers remain identical.

Production Readiness Stage Gates
Engineers authorize tooling releases only after non-linear rheological parameters align with machine pressure limits. Machine hydraulic constraints enforce strict limits on melt viscosity at maximum shear rates. Production sign-off requires complete alignment between theoretical mold filling models and actual machine transducer feedback during initial trial runs.
Documented rheological profiles match the exact temperature and shear ranges expected inside processing machinery during high-volume runs.