Auditing Factory Corrective Actions for Genuine Process Stability
Auditing factory corrective actions demands verifying physical error-proofing, statistical capability above 1.33 Cpk, and document revision control.

Filter
Manufacturing facilities facing production yields below target frequently establish offline sorting stations to protect shipping schedules. Offline sorting isolates nonconforming units after processing, creating an artificial buffer between factory line variability and customer delivery. This practice maintains shipment timing while allowing underlying equipment, tooling, or material defects to persist unchecked on the main line.
Auditing corrective actions requires peeling back these operational buffers to determine whether nonconformance root causes have been eliminated or merely screened out downstream.
Containment Artifacts in Yield Calculation
Offline rework loops distort standard line metrics by absorbing scrapped components into unrecorded scrap bins. Line supervisors record high final pass rates at packaging stations, yet the true first-pass yield upstream remains depressed. Sorting consumes working capital.
Extra shift labor and secondary inspection benches add cost without increasing component value. When audits focus solely on warehouse dispatch quality, plant management misinterprets low customer return rates as evidence of manufacturing stability.
Offline containment masks process failure. A line producing five hundred units per hour with a fifteen percent raw defect rate presents as a stable supply chain link if twenty contract inspectors sort parts overnight. The cost of nonconformance transfers to inventory holding accounts and scrap accruals.
True process capability remains unmeasured because defect generation rates are hidden behind inventory buffers.
Sorting operations conceal underlying process variance while consuming working capital in extra shift labor.
Screening Efficacy and Human Failure Rates
Manual visual inspection catches roughly eighty-five percent of surface defects under standard plant lighting conditions. Human inspection remains imperfect. Expecting hundred-percent containment through manual screening guarantees that nonconforming inventory will eventually leak into customer shipments.
Operator fatigue setting in after four hours reduces visual detection thresholds, expanding the range of acceptable surface blemishes.
Auditing an open corrective action report begins by examining the containment methodology. If the containment plan relies entirely on increased sampling frequency or additional visual check stations, the process remains vulnerable. True corrective action targets the upstream transformation step where the variance originates.
- Sorting station leakage permits nonconforming parts to pass into finished goods when operator fatigue setting in after four hours reduces visual detection thresholds.
- Uncalibrated screening gages generate false passes by allowing drift beyond lower specification limits during extended shift runs.
- Bypassed quarantine holds release unverified inventory directly into shipping lanes when warehouse space reaches capacity limits.
- Informal boundary samples create subjective judgment calls between quality control shifts, expanding accepted variation boundaries without written engineering sign-off.
Plant managers often explain that temporary sorting gates remain active because high customer order volume leaves no machine time open for permanent tooling modifications.

Mechanism
Effective root cause discovery targets the physical interaction between machine, material, and parameter settings. Generic root cause classifications such as human error, operator distraction, or inadequate training point to incomplete failure investigations. When an audit uncovers corrective action records listing retrained operator as the sole remediation step, the corrective action has failed to identify the underlying physical breakdown.

Root Cause Categorization and Human Error Reductions
Attributing nonconformance to operator inattention masks underlying ergonomic hazards, ambiguous assembly instructions, or inadequate fixture clamping force. Administrative changes fail over time. Human operators adapt to machine anomalies, working around fixture play or thermal drift until subtle shifts in raw material batch properties trigger dimensional failures.
Poka-yoke controls eliminate human error. Sustainable corrective actions implement physical modifications that make nonconformance impossible. Mechanical stops prevent misplacement.
Optical sensors block cycle start when components sit improperly in precision nests.
- Audit the physical workstation to verify that fixture guide pins physically reject misaligned stamped housings before pneumatic clamps engage.
- Review machine PLC ladder logic to confirm that pressure sensors halt cycle initiation whenever hydraulic pressure drops below forty-five bars.
- Inspect scrap logs from the preceding thirty production shifts to cross-reference component failure modes against tool wear maintenance intervals.
- Execute five simulated error cycles using tagged defective calibration samples to confirm automated vision camera rejection gates trigger correctly.
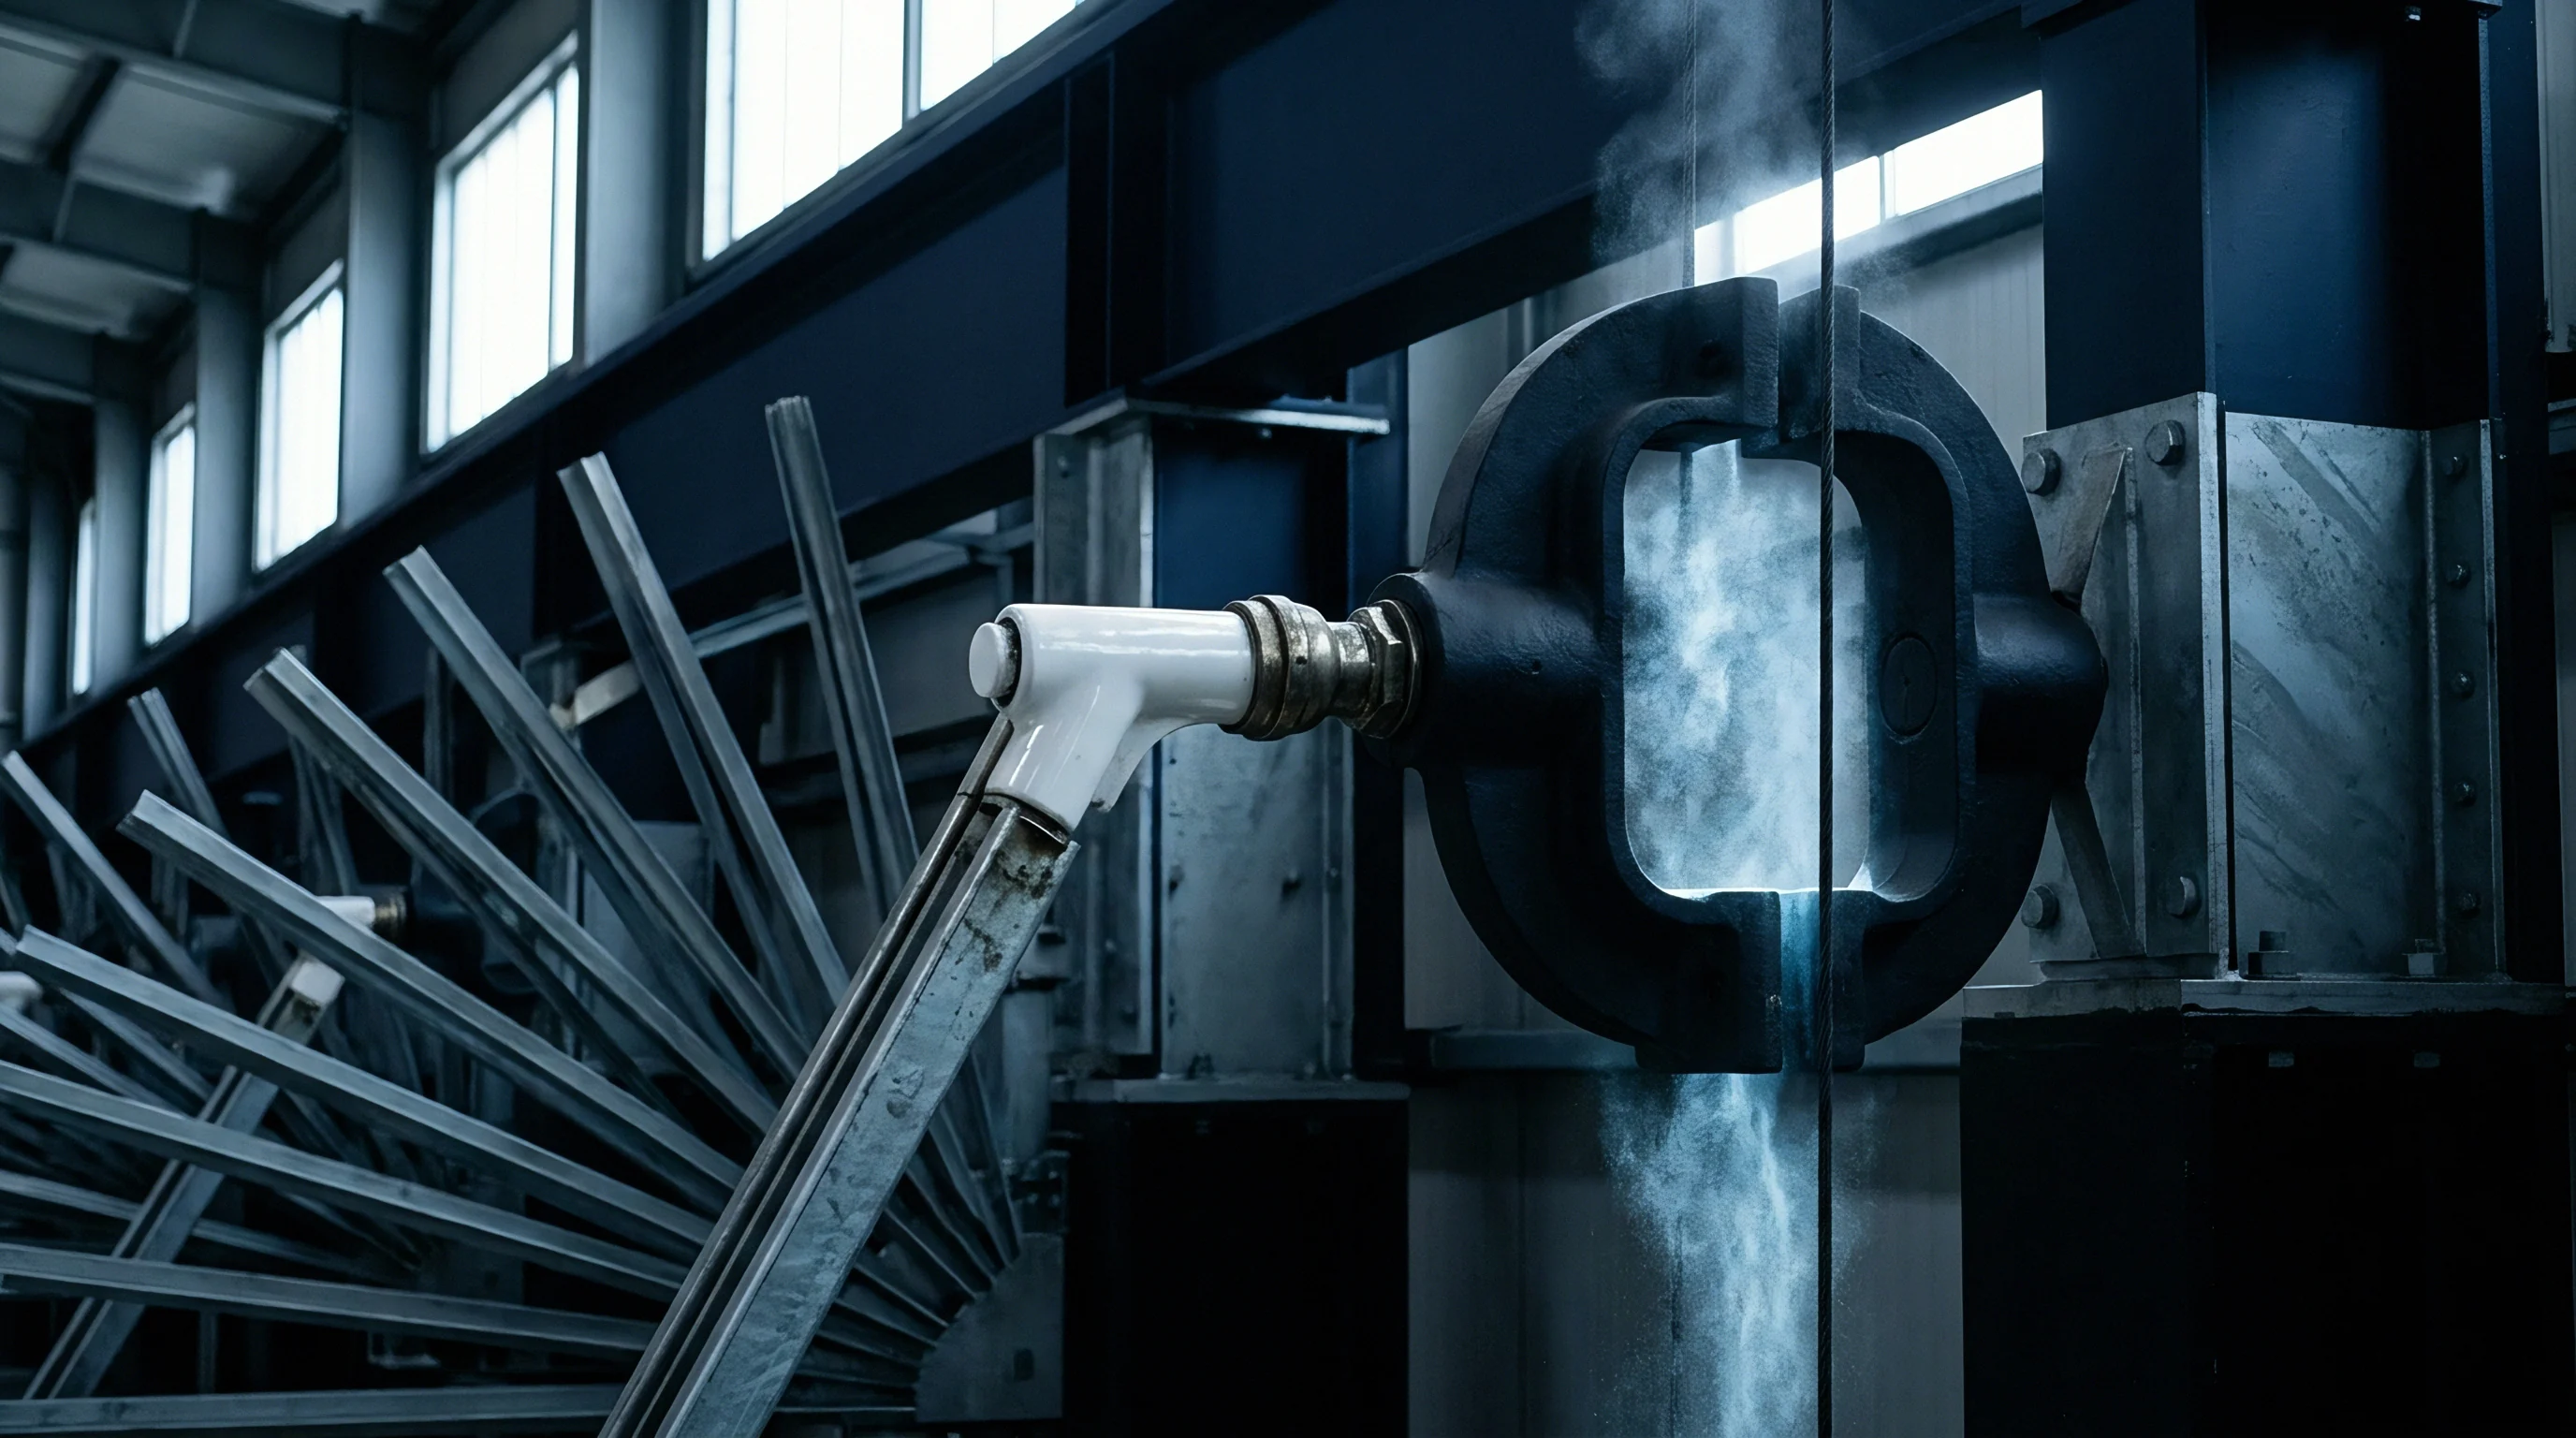
Poka Yoke Design and Physical Constraints
Engineering controls sit at the top of the corrective action hierarchy. Modifying cutting tool geometry to allow single-direction installation eliminates orientation errors without requiring operator vigilance. Automated vision systems integrated into high-speed assembly lines measure critical dimensions on every unit, rejecting out-of-tolerance components before secondary processes add value.
| Control Level | Action Type | Implementation Mechanism | Historical Recurrence Rate (%) |
|---|---|---|---|
| Administrative | Standard Work Revision | Updated shop floor instructions and operator retraining sign-offs | 34.2 |
| Screening | Added Inspection Gate | Offline hundred-percent manual check bench with boundary samples | 18.6 |
| Semi-Automated | Sensor Integration | Photoelectric presence check interlocked to cycle start button | 3.1 |
| Poka-Yoke | Physical Asymmetry | Mechanical keyed tooling allowing single-orientation insertion | 0.02 |
Tool wear alters dimensions. Machining centers experience thermal expansion during early shift warm-up phases, altering bore dimensions by up to twelve microns. Corrective actions addressing dimensional drift must incorporate automated tool wear compensation probes or closed-loop temperature control units rather than relying on periodic manual micrometer measurements.
Hard physical poka-yoke interventions reduce defect recurrence to zero point zero two percent across automated assembly operations.
IATF 16949 Clause 10.2.3 mandates that error-proofing devices undergo documented challenges during every shift change, transforming quality control from periodic auditing into continuous physical validation.

Gauge
Statistical verification demands rigorous measurement system analysis before process data reflects genuine production capability. Measuring instruments introduce variance into recorded data. Gauge repeatability and reproducibility studies confirm whether measurement system error consumes an acceptable portion of total tolerance bands.
Process Capability Indices and Subgroup Sampling
Calculating baseline Cpk values requires thirty distinct subgroups of five consecutive units collected under stable thermal and mechanical equilibrium. Data collection requires strict sampling. Short production runs with small sample counts produce skewed capability estimates, underestimating long-term process spread.
Capability indices quantify variance. Consider a precision CNC shaft grinding operation running steel rod stock with a shaft diameter tolerance of 25.000 millimeters plus or minus 0.050 millimeters. The upper specification limit sits at 25.050 millimeters, while the lower specification limit sits at 24.950 millimeters.
Prior to corrective action implementation, baseline measurements across one hundred fifty units yielded a sample mean of 25.020 millimeters with a standard deviation of 0.015 millimeters. Under these baseline conditions, process capability calculations reveal:
Cp = (25.050 – 24.950) / (6 0.015) = 0.100 / 0.090 = 1.11
Cpk = Min = Min = 0.67
A Cpk of 0.67 indicates severe process centering off-target combined with wide dispersion, generating roughly 2.28 percent scrap. The corrective action team identified spindle bearing play and cutting fluid thermal fluctuation as joint root causes. Engineers replaced spindle bearings and installed closed-loop fluid chillers.
Post-implementation verification sampled one hundred fifty units across three consecutive shifts, yielding a revised sample mean of 25.002 millimeters and a reduced standard deviation of 0.007 millimeters:
Cp = (25.050 – 24.950) / (6 0.007) = 0.100 / 0.042 = 2.38
Cpk = Min = Min = 2.28
Has Statistical Significance Reached the Sampling Threshold?
Demonstrating permanent defect reduction requires a sample size large enough to achieve ninety-five percent statistical confidence at the expected defect rate. Small sample verification risks mistaking temporary luck for permanent process stability. Random variation causes noise.
Auditing teams apply two-sample t-tests and F-tests to confirm that post-corrective action mean shifts and variance reductions represent statistically significant process changes rather than temporary sampling noise.
| Parameter | Baseline (Pre-CAPA) | Interim (Sorting Phase) | Verified (Post-CAPA) | Acceptance Threshold |
|---|---|---|---|---|
| Process Mean (mm) | 25.020 | 25.018 | 25.002 | 25.000 ± 0.005 |
| Standard Deviation (mm) | 0.015 | 0.014 | 0.007 | < 0.008 |
| Process Capability (Cp) | 1.11 | 1.19 | 2.38 | > 1.67 |
| Process Capability Index (Cpk) | 0.67 | 0.76 | 2.28 | > 1.33 |
| Defect Rate (PPM) | 22,800 | 12,400 | 0.02 | < 3.4 |
| Subgroup Count (N=5) | 30 | 30 | 30 | Min 30 |
Process capability metrics must hold across multiple raw material heat lots. Steel tensile strength variations from batch to batch alter springback during stamping steps, requiring adaptive press force controls to sustain Cpk targets above 1.33.
Stable process control charts show points distributed randomly around the central line without non-random patterns or trends.
Process stability exists only when statistical control charts show random variation around the centerline over extended production runs.


Ledger
Documentary evidence proves whether corrective actions exist in daily shop-floor reality or remain confined to administrative records. Paper compliance occurs when engineering change notices sit unapproved while factory operators run machinery using obsolete work instructions. Drawing updates prevent reversion.
Auditing closed corrective action files requires physical confirmation at the workstation bench.
Engineering Change Notice Verification
Updating work instructions without modifying mechanical drawings allows obsolete tooling configurations to re-enter production during emergency changeovers. Engineering change notices lock in physical modifications. When a corrective action requires altering a hole diameter, the corresponding CAD model, tool path program, and quality inspection plan must reflect the identical revision letter.
Unverified actions cause repeat defects. Computerized maintenance management systems must capture modified preventative maintenance schedules resulting from corrective action investigations. If an investigation determines that hydraulic filter clogging caused pressure drops, the maintenance ledger must show shortened filter replacement intervals.

Closed Loop Record Auditing Protocols
Cross-referencing customer complaint logs against internal scrap records exposes discrepancies between internal quality reports and field performance. Quality managers track corrective action closure rates, but rapid closure often signals superficial documentation rather than thorough engineering resolution.
- Engineering drawing revision control confirms that CAD models, machining programs, and floor prints share identical revision letters across all workstation displays.
- Operator training sign-off logs verify that floor technicians completed hands-on verification of revised standard work instructions before line restart.
- Preventive maintenance integration demonstrates that altered cleaning, lubrication, or tool-replacement intervals appear inside automated CMMS scheduling modules.
- FMEA rating adjustments show reduced occurrence and detection scores reflected in updated design and process failure mode analysis risk priority numbers.
Failure mode and effects analysis documents serve as living historical logs. Following a corrective action, the process failure mode analysis must show reduced occurrence ratings based on physical poka-yoke installation, or reduced detection ratings based on automated vision checks.
ISO 9001 Clause 10.2.1 mandates that corrective action records detail nonconformance nature, actions taken, and subsequent effectiveness review results.
Failing to audit documentary trails permits systemic defects to re-emerge during customer ramp-up phases, triggering product recalls and severe contractual breach penalties.


Proof
Final sign-off on factory corrective actions determines whether an enterprise releases expansion capital or halts volume allocation. Process drift threatens yield. Scaling production before verifying corrective action effectiveness multiplies existing scrap rates across higher production volumes.
Capital allocation depends on proof.

Stage Gate Criteria for Volume Scale Up
Clearing the production ramp gate requires thirty consecutive calendar days of shift runs achieving baseline Cpk targets without active sorting gates. Ramp approval demands verified stability. Operational managers must reject requests to increase line speed until line capability proves robust under full thermal loading.
Capacity claims mean nothing if line speed acceleration increases scrap generation. Process capability audits evaluate process stability across all operational shifts, confirming that night shift runs achieve equivalent dimensional control without expert engineering support on site.

Post Implementation Auditing Horizons
Sustained process control requires quarterly re-audits of high-risk process steps to confirm control plan adherence. Unannounced shop-floor audits verify that operators follow modified work instructions and that automated error-proofing devices undergo shift-change challenge tests.
Supply agreements incorporate corrective action audit findings into vendor rating scores. Persistent nonconformance recurrence triggers formal business hold status, blocking new product introduction awards until third-party quality auditors certify corrective action effectiveness on production lines.
Engineers continue to debate whether long-term process capability can ever be fully proven without running high-stress thermal and load cycling across multiple material batches over an entire seasonal weather rotation.