Assessing Manufacturing Process Capability and Pilot Line Thermal Equilibrium
Uncompensated thermal non-equilibrium inflates baseline manufacturing process variance, distorting capability indices until thermal steady state is reached.

Soak
Pilot lines frequently yield misleading process capability metrics because thermal stabilization lags behind mechanical startup. Machine frames, heating platens, extrusion dies, and fluid channels shift continuously in temperature during early qualification runs. Taking dimensional or physical property samples before machinery settles into internal energy balance conflates thermal drift with baseline mechanical variation, distorting both short-term capability indices and long-term performance assessments.
Heat moves between equipment mass and ambient surroundings whenever a line runs outside thermal steady state. Heavy gantries, steel rollers, and casting molds often take hours to soak through. As a consequence, properties such as web thickness, polymer density, coating weight, or press yield exhibit directional trends over time.
Calculating capability statistics during this transient period folds deterministic drift into the common-cause variance estimator, inflating standard deviation figures and prompting engineers to adjust tooling that was already dialed in.

Thermal Ramp Dynamics in Pilot Operations
Heat transfer rates depend on structural geometry, thermal diffusivity, and coolant flow rates. Massive assemblies require substantial time to equilibrate; a heated calendering roll with a heavy core, for example, carries a thermal time constant of several hours. Surface thermocouples may register target operating temperatures early in a shift while steep internal gradients persist, driving mechanical expansion long after surface readings have plateaued.
The Biot number governs heat transfer through solid machinery components. When internal conductive resistance exceeds external convective cooling, core temperature gradients persist under cyclic load. Sampling product output under these conditions measures a moving target, yielding capability estimates that reflect transient thermodynamics rather than repeatable steady-state performance.
| Process Metric | Transient Thermal State | Equilibrium Thermal State | Analytical Risk |
|---|---|---|---|
| Short-Term Capability Index (Cp) | Suppressed (1.02 to 1.18) | True Operational Level (1.65 to 1.82) | Underestimates intrinsic machine precision; triggers capital expense. |
| Upper Capability Index (Cpk) | Skewed by Directional Shift | Stable Centered Distribution | Induces false out-of-spec warnings; prompts unnecessary adjustments. |
| Overall Performance Index (Pp) | Severely Depressed (0.78 to 0.95) | Converges Near Short-Term Capability | Confounds dynamic thermal drift with fundamental equipment variance. |
| Lower Performance Index (Ppk) | Extremely Volatile | Direct Alignment with Centering | Disrupts customer acceptance audits; delays line qualification. |
Pilot scale-up runs are routinely brief. These limited lot sizes mean equipment rarely reaches stable temperatures before production finishes. Operators frequently attribute part-to-part dimensional shifts to tool wear or batch variation when the machinery is simply absorbing heat, inflating statistical spread and masking baseline machine capability.

Baseline Distortion in Short Production Runs
Thermal drift dominates measured variance across short pilot runs. Standard SPC assumes process data originates from an independent, identically distributed source around a stationary mean. Thermal non-equilibrium directly violates this premise by drifting the mean from one subgroup to the next.
The statistical spread recorded during a thirty-minute pilot ramp reflects dynamic energy redistribution rather than mechanical tooling error.
Assessing performance indices on cold or partially soaked lines exaggerates total process variation. Traditional rational subgrouping breaks down when drift occurs within individual subgroup windows: parts produced minutes apart show tight within-subgroup variance, while total shift-wide standard deviation expands, generating an artificial split between short-term capability and overall performance metrics.
Thermal Mass and Transient Heating Profiles
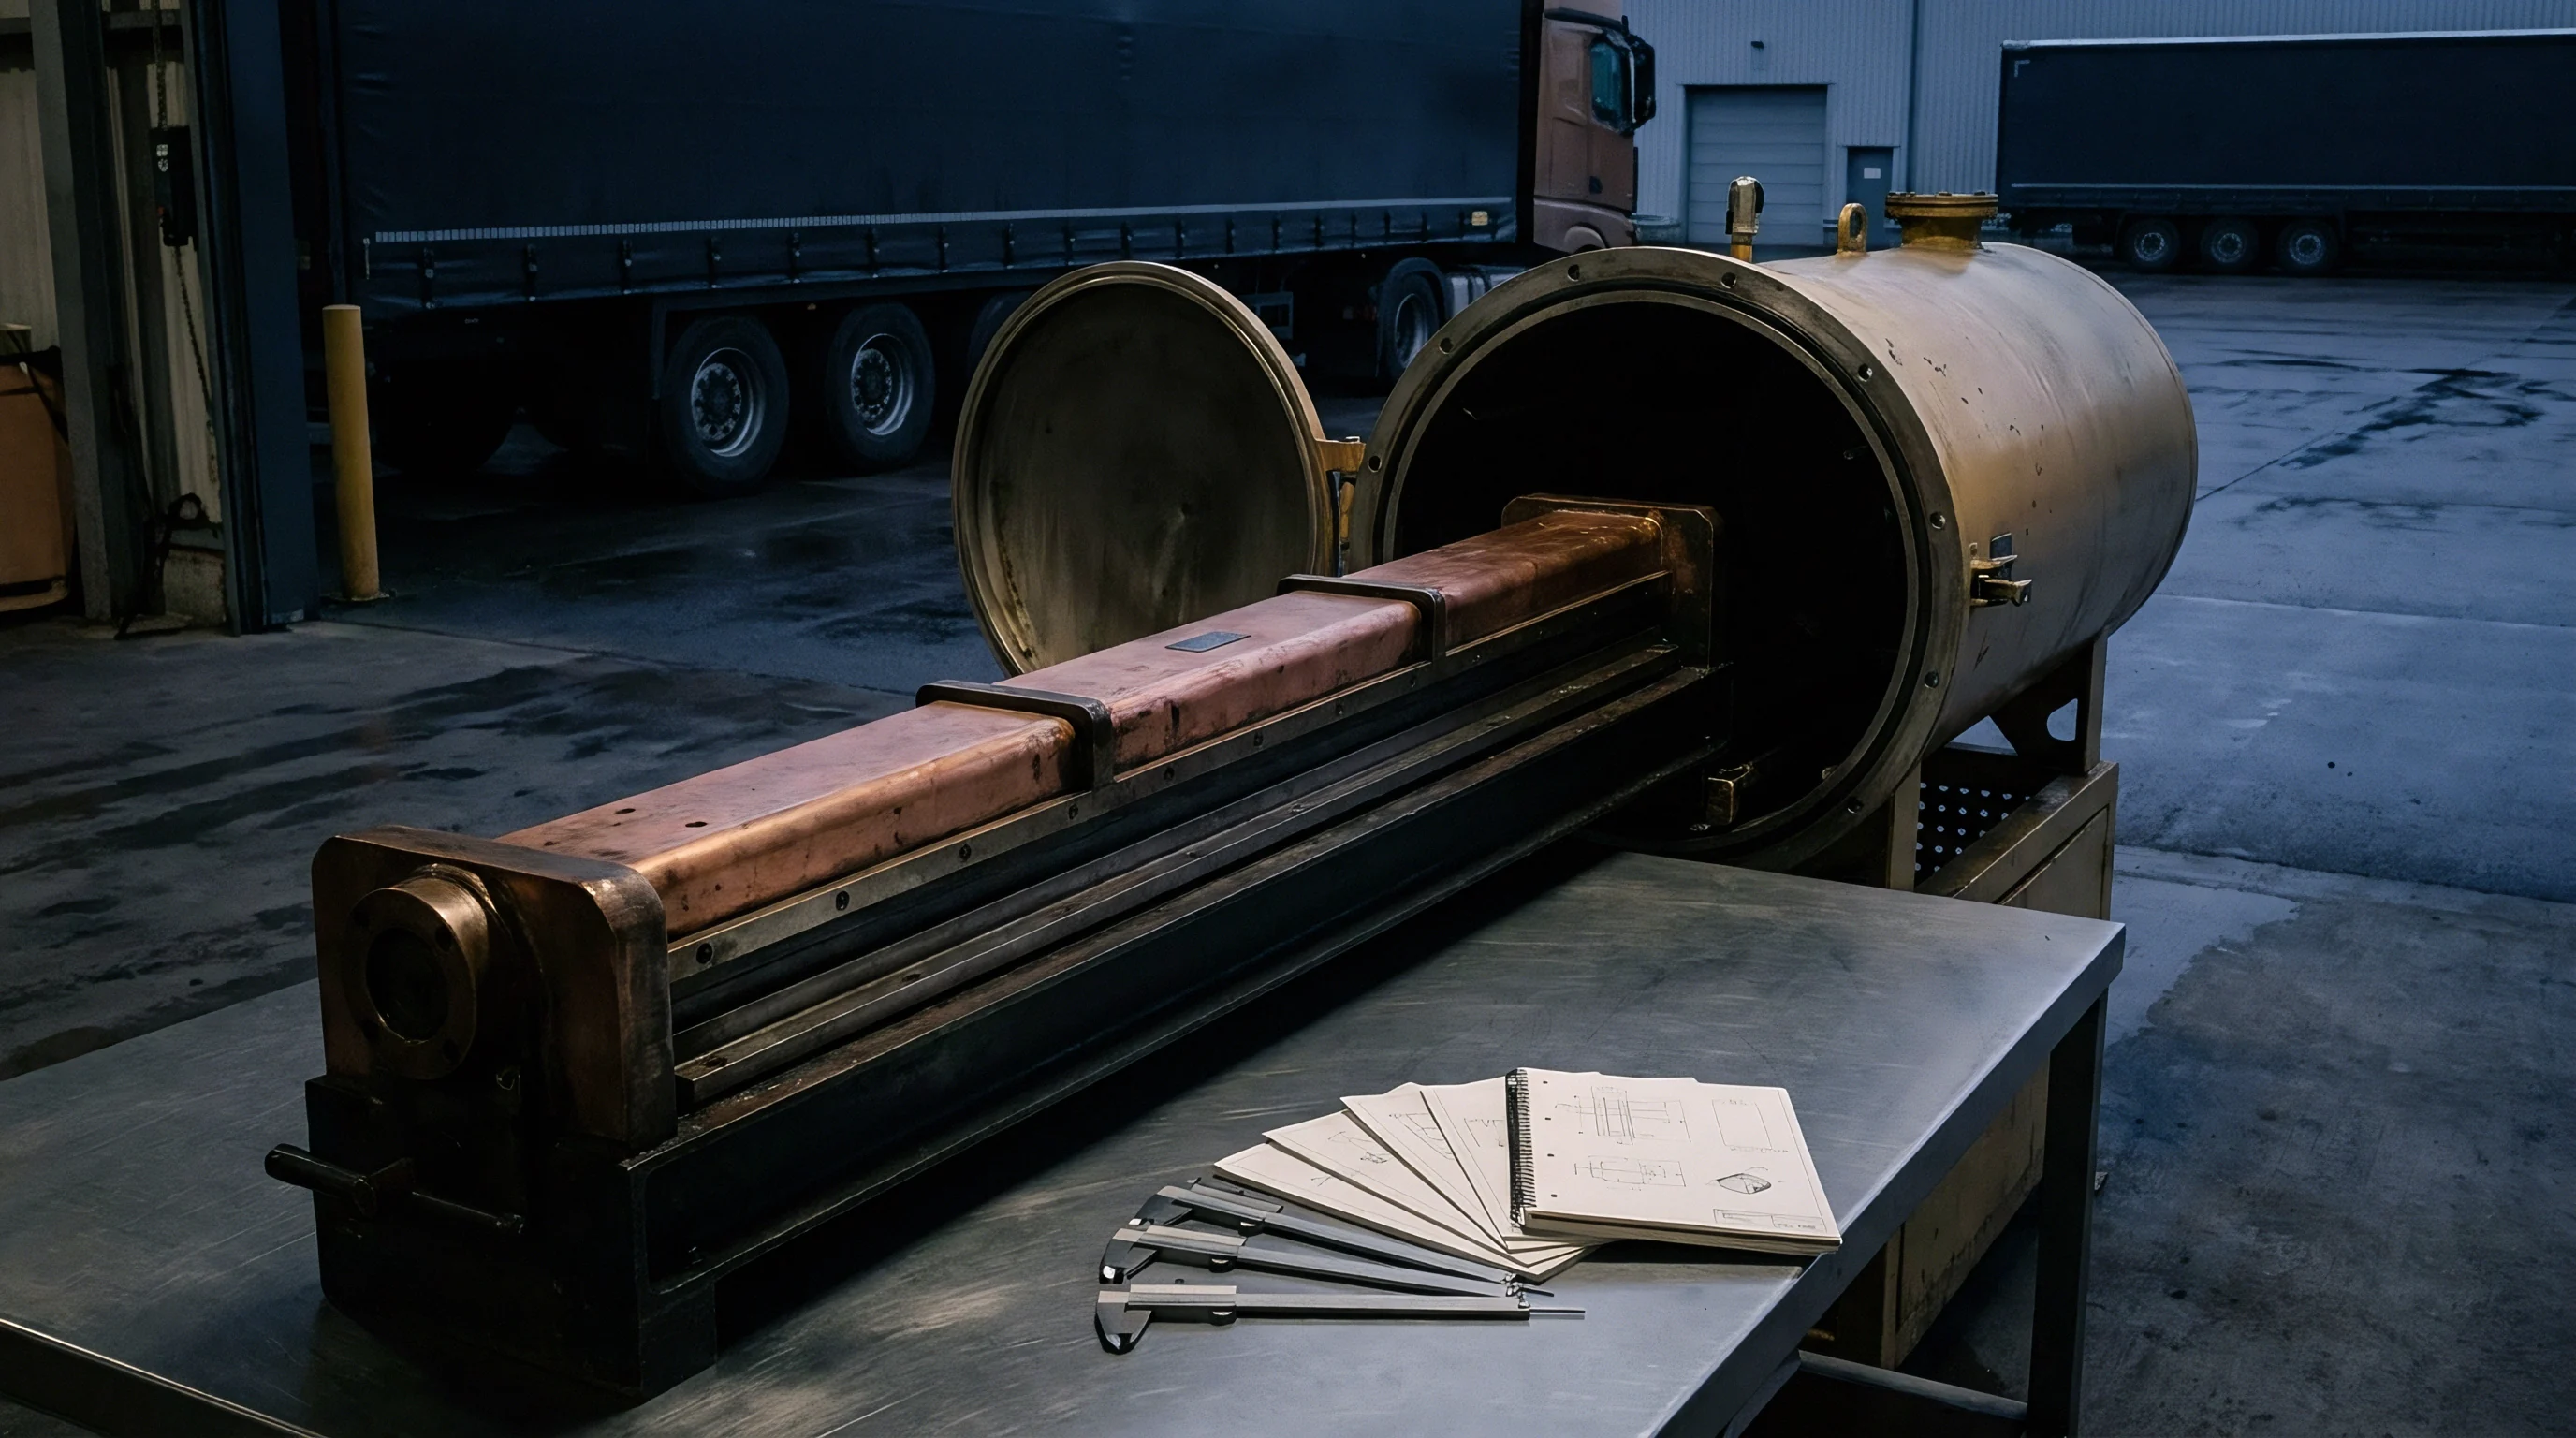
Component mass determines how much thermal energy machinery absorbs before reaching equilibrium. Heavy steel tooling on a pilot line requires considerable heat accumulation before thermal input balances radiation and convection losses. Massive baseplates and beds act as heat sinks, siphoning energy from process zones and altering mechanical operating clearances between moving parts.
Dynamic thermal instability on pilot lines typically stems from several distinct mechanisms:
- Intermittent Line Stoppages cause rapid surface cooling on exposed tooling while internal mass stays warm, creating steep thermal gradients when the line restarts.
- Variable Ambient Convection from local air currents alters boundary layers and shifts surface equilibrium points throughout the day.
- Non-Uniform Fluid Flow inside heating and cooling jackets leaves thermal gradients across wide web surfaces.
- Uncalibrated Heater Zones force adjacent zones to cross-couple thermally, driving temperature hunting along the line.
Line stoppages compound these thermal disruptions. While idle, heat concentrates in static contact areas, generating localized hot zones; restarting introduces cold material across these overheated surfaces, producing abrupt recovery spikes. Thermal trend data shows that transient process instability often traces directly to stoppage history rather than raw material inconsistencies.
Does the pilot line design include insulation to limit heat transfer into frame structural elements?

Drift
Isolating thermal movement from core machine variation requires deliberate analytical separation. Standard capability formulas lump structural thermal expansion together with mechanical backlash, bearing runout, and feed variations. Evaluating actual steady-state capability requires separating time-dependent thermal trends from high-frequency process noise.
Time-series filtering and variance partitioning allow quality engineers to isolate thermal components. Logging structural temperatures alongside key quality characteristics enables regression of dimensional change against thermocouple data. Filtering out both linear and non-linear drift isolates the residual variance that represents true short-term machine capability.

Separating Thermal Trends from Intrinsic Variance
Decoupling process noise from thermal drift requires a structured sequence. If predictable thermal patterns are not extracted first, capability indices remain artificially depressed, prompting unnecessary mechanical modifications.
- Install surface and internal thermocouples at critical thermal nodes on the frame, logging temperature streams in sync with product measurement points.
- Sample product at high rates during startup, pairing every dimensional check with corresponding system temperatures.
- Plot part dimensions against elapsed time to identify directional shift patterns in early output.
- Fit linear and polynomial regression models to isolate dimensional variance tied directly to thermal node shifts.
- Subtract predicted thermal expansion from observed dimensions to isolate residual variance.
- Calculate corrected capability metrics from that residual variance to establish baseline machine performance.
Extracting thermal correlation from raw process data uncovers baseline equipment variation. When residual variance satisfies capability requirements, mechanical tolerances are sound, allowing engineering to focus on soak cycles and thermal management rather than tool redesign.

Should Sampling Frequency Increase during Thermal Ramp?
Dense sampling throughout warmup helps characterize system thermal time constants. Routine SPC sampling intervals assume steady-state conditions; during a thermal ramp, sparse measurement intervals fold systematic drift into random variation, obscuring root causes.
High-frequency measurements taken at startup capture non-linear expansion curves and pinpoint the inflection point where rapid growth transitions into steady-state operation. Once the rate of temperature change falls below target thresholds, sampling intervals can safely drop back to standard quality control frequencies.
| Model Type | Mathematical Formulation | Primary Application | Limitations |
|---|---|---|---|
| Linear Thermal Regression | Y = Beta_0 + Beta_1 Temp + Epsilon | Simple linear expansion in single-axis tooling structures. | Fails during exponential thermal ramp transitions. |
| Exponential Warmup Model | Y = Y_eq + Delta_Y exp(-t / Tau) + Epsilon | First-order thermal mass heat soaking profiles. | Requires continuous uninterrupted warmup test data. |
| Two-Way ANOVA Decomposition | Var(Total) = Var(Thermal) + Var(Mechanical) + Var(Error) | Partitioning multi-zone tooling thermal interactions. | Assumes orthogonal operational factor inputs. |
| Autoregressive Time Series (ARIMA) | Y_t = Correlation(Y_t-1) + Thermal_Effect + Epsilon_t | Continuous web and high-speed dynamic process lines. | Demands large continuous statistical sample sizes. |
Comparing residual error terms against specification limits provides an accurate evaluation of machine capability. Analyzing the thermal decay curve during ramp testing confirms that residual variance stays under twenty percent of the total tolerance band.
Time-Series Decomposition and Analysis of Variance
Variance decomposition separates total process dispersion into mechanical noise, raw material fluctuations, measurement error, and thermal drift. ANOVA models isolate the thermal contribution by including temperature zone readings as explicit covariates.
Process capability calculations conducted without compensating for measurable thermal gradients overstate intrinsic machine error by up to three hundred percent.
Removing thermal variance reveals actual baseline capability. If corrected metrics pass while unadjusted data fails, the root cause lies in thermal control rather than mechanical tolerance, directing corrective efforts toward loop tuning, fluid delivery, or structural insulation.
Thermal stability requires overall system temperature change to drop below one degree Celsius per hour before capability sampling starts.

Gage
Measurement error increases whenever metrology equipment operates in shifting thermal conditions. Non-contact sensors, optical micrometers, touch probes, and load cells all experience zero-point drift and span shifts as ambient or target part temperatures vary during pilot runs.
Gage R&R studies conducted at ambient room temperature do not reflect measurement error on an operating line. Sensor mounting brackets expand under heat, shifting optical path lengths and probe alignment, while pyrometers drift as material surface emissivity changes during warmup.

Metrological Instability under Dynamic Temperatures
Thermal gradients warp measurement frames, altering the spatial relationship between sensor heads and inspected parts. Aluminum mounting brackets expand by twenty-three micrometers per meter for every degree Celsius increase, displacing zero baselines throughout the warm-up cycle.
Laser gages and optical micrometers drift when fluctuating air density alters the refractive index across thermal boundary layers. Rising thermal plumes scatter optical paths, introducing apparent process variation that laboratory calibrations do not encounter.
| Sensor Mechanism | Primary Thermal Error Source | Magnitude of Error | Corrective Engineering Action |
|---|---|---|---|
| Infrared Pyrometry | Material Emissivity Drift during Phase Change | 5 to 18 percent offset | Install dual-wavelength ratio pyrometers with active emissivity feedback loops. |
| Laser Triangulation | Refractive Index Turbulence in Boundary Layer | 2 to 12 micrometers blur | Implement localized laminar air purge systems over optical measurement paths. |
| LVDT Contact Probes | Linear Thermal Expansion of Mechanical Arms | 8 to 25 micrometers shift | Utilize Invar low-expansion alloys for sensor mounting frames and extension rods. |
| Strain Gage Load Cells | Bridge Resistance Temperature Coefficient Shift | 0.5 to 3 percent scale error | Apply active internal temperature compensation circuits and localized insulation. |
Validating measurement error across actual operating temperatures prevents distorted capability findings. Tracking a thermally stable calibration artifact through line warmup quantifies true metrology drift.

Sensor Calibration Lag and Emissivity Shifts
Contact probes conduct heat away from the inspection site, chilling the local contact point while warming the probe stem and shifting the resulting measurement. Non-contact instruments eliminate heat conduction but remain sensitive to shifting surface radiation characteristics.
Preserving measurement integrity under thermal load requires addressing specific sensor behaviors:
- Emissivity Calibration Offsets distort pyrometer readings when material phase, color, or surface roughness changes during processing.
- Thermocouple Response Time Lag delays feedback when heavy thermowells slow heat flow to the internal junction.
- Reference Junction Drift degrades signal accuracy when ambient heat builds up around unshielded signal modules.
- Refractive Index Gradient Distortion adds noise to laser gages aimed through hot air convection currents.
Failing to account for thermal dynamics in metrology hardware distorts capability indices. As gage uncertainty rises during warmup, total observed variance broadens, masking true machine consistency.
Uncompensated expansion in sensor brackets can swallow up to forty percent of a part’s total tolerance band during pilot qualification.
Gate
Pilot line sign-off requires stage-gate criteria that mandate thermal steady state before capability evaluations begin. Approving capability metrics gathered during a thermal ramp risks qualifying an unstable process, leading to elevated scrap, sorting, and warranty costs down the line.
Stage-gate protocols must define precise thermal stability thresholds that precede formal capability runs. Procedures need to document specific sensor locations, stabilization intervals, maximum drift rates, and run durations required to verify equilibrium.

Quantitative Criteria for Thermal Steady State
Thermal equilibrium occurs when machine heat input equals heat dissipation through convection, radiation, and conduction. Quantifying this balance eliminates operator guesswork during line qualification.
Monitoring structural node temperatures over time confirms stability. Once temperature slopes remain within defined limits over a set window, capability data collection can begin.
Pilot line qualification depends on satisfying specific thermal stability thresholds:
- Maximum Temperature Slope must stay under 0.5 degrees Celsius per fifteen-minute interval across all structural bearing blocks and die zones.
- Cross-Machine Gradient Delta must hold within 1.2 degrees Celsius across the active width at full production throughput.
- Thermal Recovery Duration after line pauses must bring key zones back to operating ranges within four minutes of restart.
- Steady State Soak Window requires maintaining thermal stability continuously for at least two hours before drawing capability samples.
Enforcing these gate criteria prevents premature capability sign-offs, ensuring metrics reflect long-term manufacturing performance under true operating conditions.
Stage-Gate Requirements for Process Capability Verification
Stage-gate reviews safeguard capital investment by enforcing objective stability standards. Review packages require documented temperature stabilization records alongside reported capability indices.
Process capability documentation lacking synchronized temperature stabilization records fails to prove long-term manufacturing capability.
Qualification packages must pair temperature trend logs directly with sample collection intervals. Synchronizing dimensional data with thermal history provides verifiable proof of process stability.
Observed dimensional drift is often attributed to raw material variation when un-soaked tooling is the actual source.


Yield
Operating outside thermal equilibrium during startup directly increases production costs through scrap generation, extended cycle times, and energy consumption. Lines with long thermal stabilization periods produce out-of-spec output after every cold start, driving up unit manufacturing costs.
Quantifying warmup losses provides the financial justification for thermal control upgrades. Fast-response heaters, heat pipes, low-expansion alloys, and active thermal management shorten startup waste and improve ramp economics.

Economic Impact of Warm-Up Scrap Rates
Warmup scrap represents a substantial financial burden in high-value manufacturing. Extrusion lines, stamping presses, roll coaters, and glass molding systems all generate off-spec material while tooling comes up to temperature.
Evaluating the total cost of thermal lag requires accounting for scrapped material, energy consumption, direct labor, and lost throughput. In continuous web converting, warmup losses during short pilot runs often outpace total steady-state scrap.
Evaluating thermal ramp costs across three typical pilot environments illustrates the financial impact of thermal lag before reaching steady state.
Case A: High-Speed Web Coating Line. The line requires a ninety-minute thermal soak to stabilize roller dimensions. Running raw web during warm-up generates $4,200 in scrap per shift change.
Implementing targeted induction heating cuts soak time to eighteen minutes, reducing warm-up scrap by eighty percent and saving over $260,000 annually.
Case B: Precision Injection Molding Operations. Shifting mold temperatures cause dimensional drift across the first fifty cycles, averaging $850 in scrap per startup. Installing active oil temperature control stabilizes mold geometry within eight cycles, saving $52,000 annually while freeing up shift capacity.
Case C: Continuous Chemical Synthesis Reactor. Thermal lag during startup creates off-spec fluid batches that require expensive disposal. Disposal fees and wasted raw materials run $12,500 per ramp cycle.
Adding a pre-heating loop eliminates off-spec material, paying for itself within four months.

Contractual Acceptance Terms for Pilot Lines
Procurement specifications must incorporate explicit thermal stabilization terms into factory and site acceptance testing. Without soak clauses, buyers risk accepting machinery that cannot maintain drawing tolerances during ordinary production restarts.
Standard equipment contracts mandate demonstration of target capability (Cpk ge 1.67) over designated run periods. Without defined pre-soak conditions, equipment can be preheated for hours before testing, masking slow thermal response and high startup scrap rates.
Acceptance protocols must tie capability demonstrations directly to cold-start timelines, defining maximum warmup durations and scrap limits required to achieve target indices.
Under the performance guarantee terms of Clause 8.4, the equipment manufacturer warrants that the production line will achieve a minimum short-term capability index of 1.67 within thirty minutes of cold startup, limiting non-conforming warm-up material to less than two percent of total shift throughput.