Stochastic Failure Correlation Analysis for Multi Zone Automated Conveyor Buffer Capital Expenditure Allocation
Allocate buffer capital to conveyor junctions with high joint failure covariance rather than uniform spacing to prevent multi-zone cascading shutdowns.
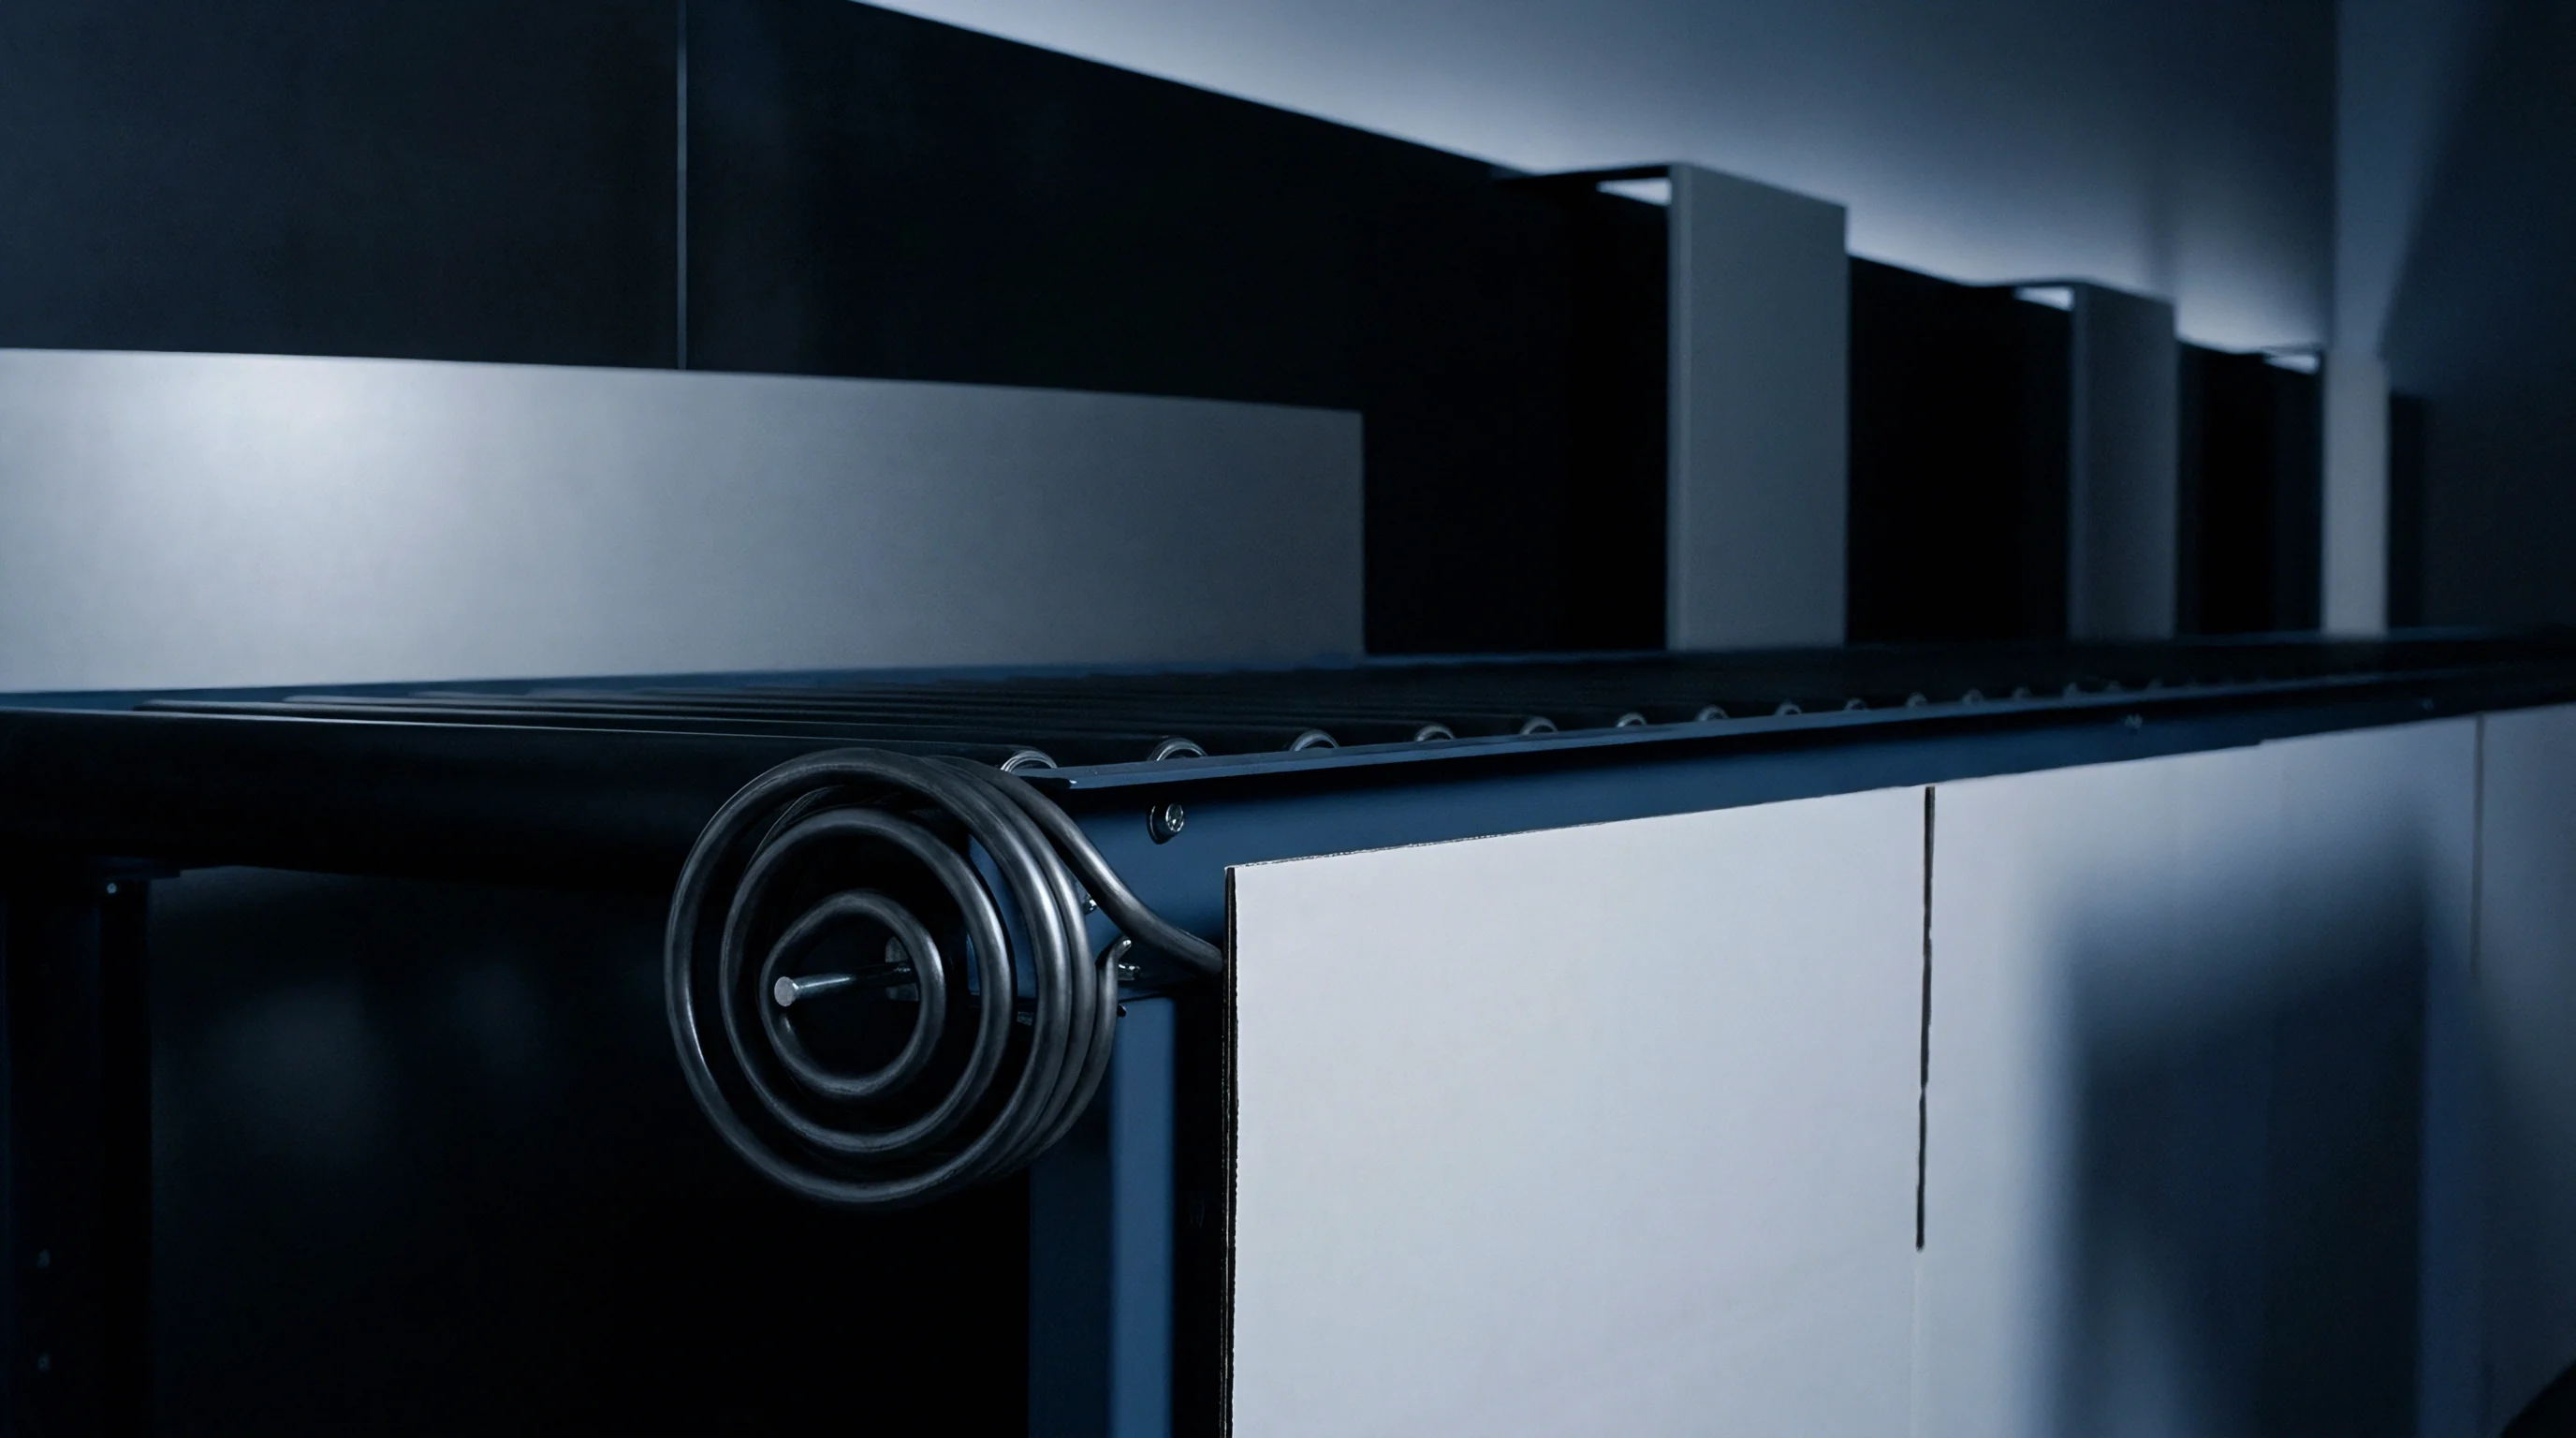
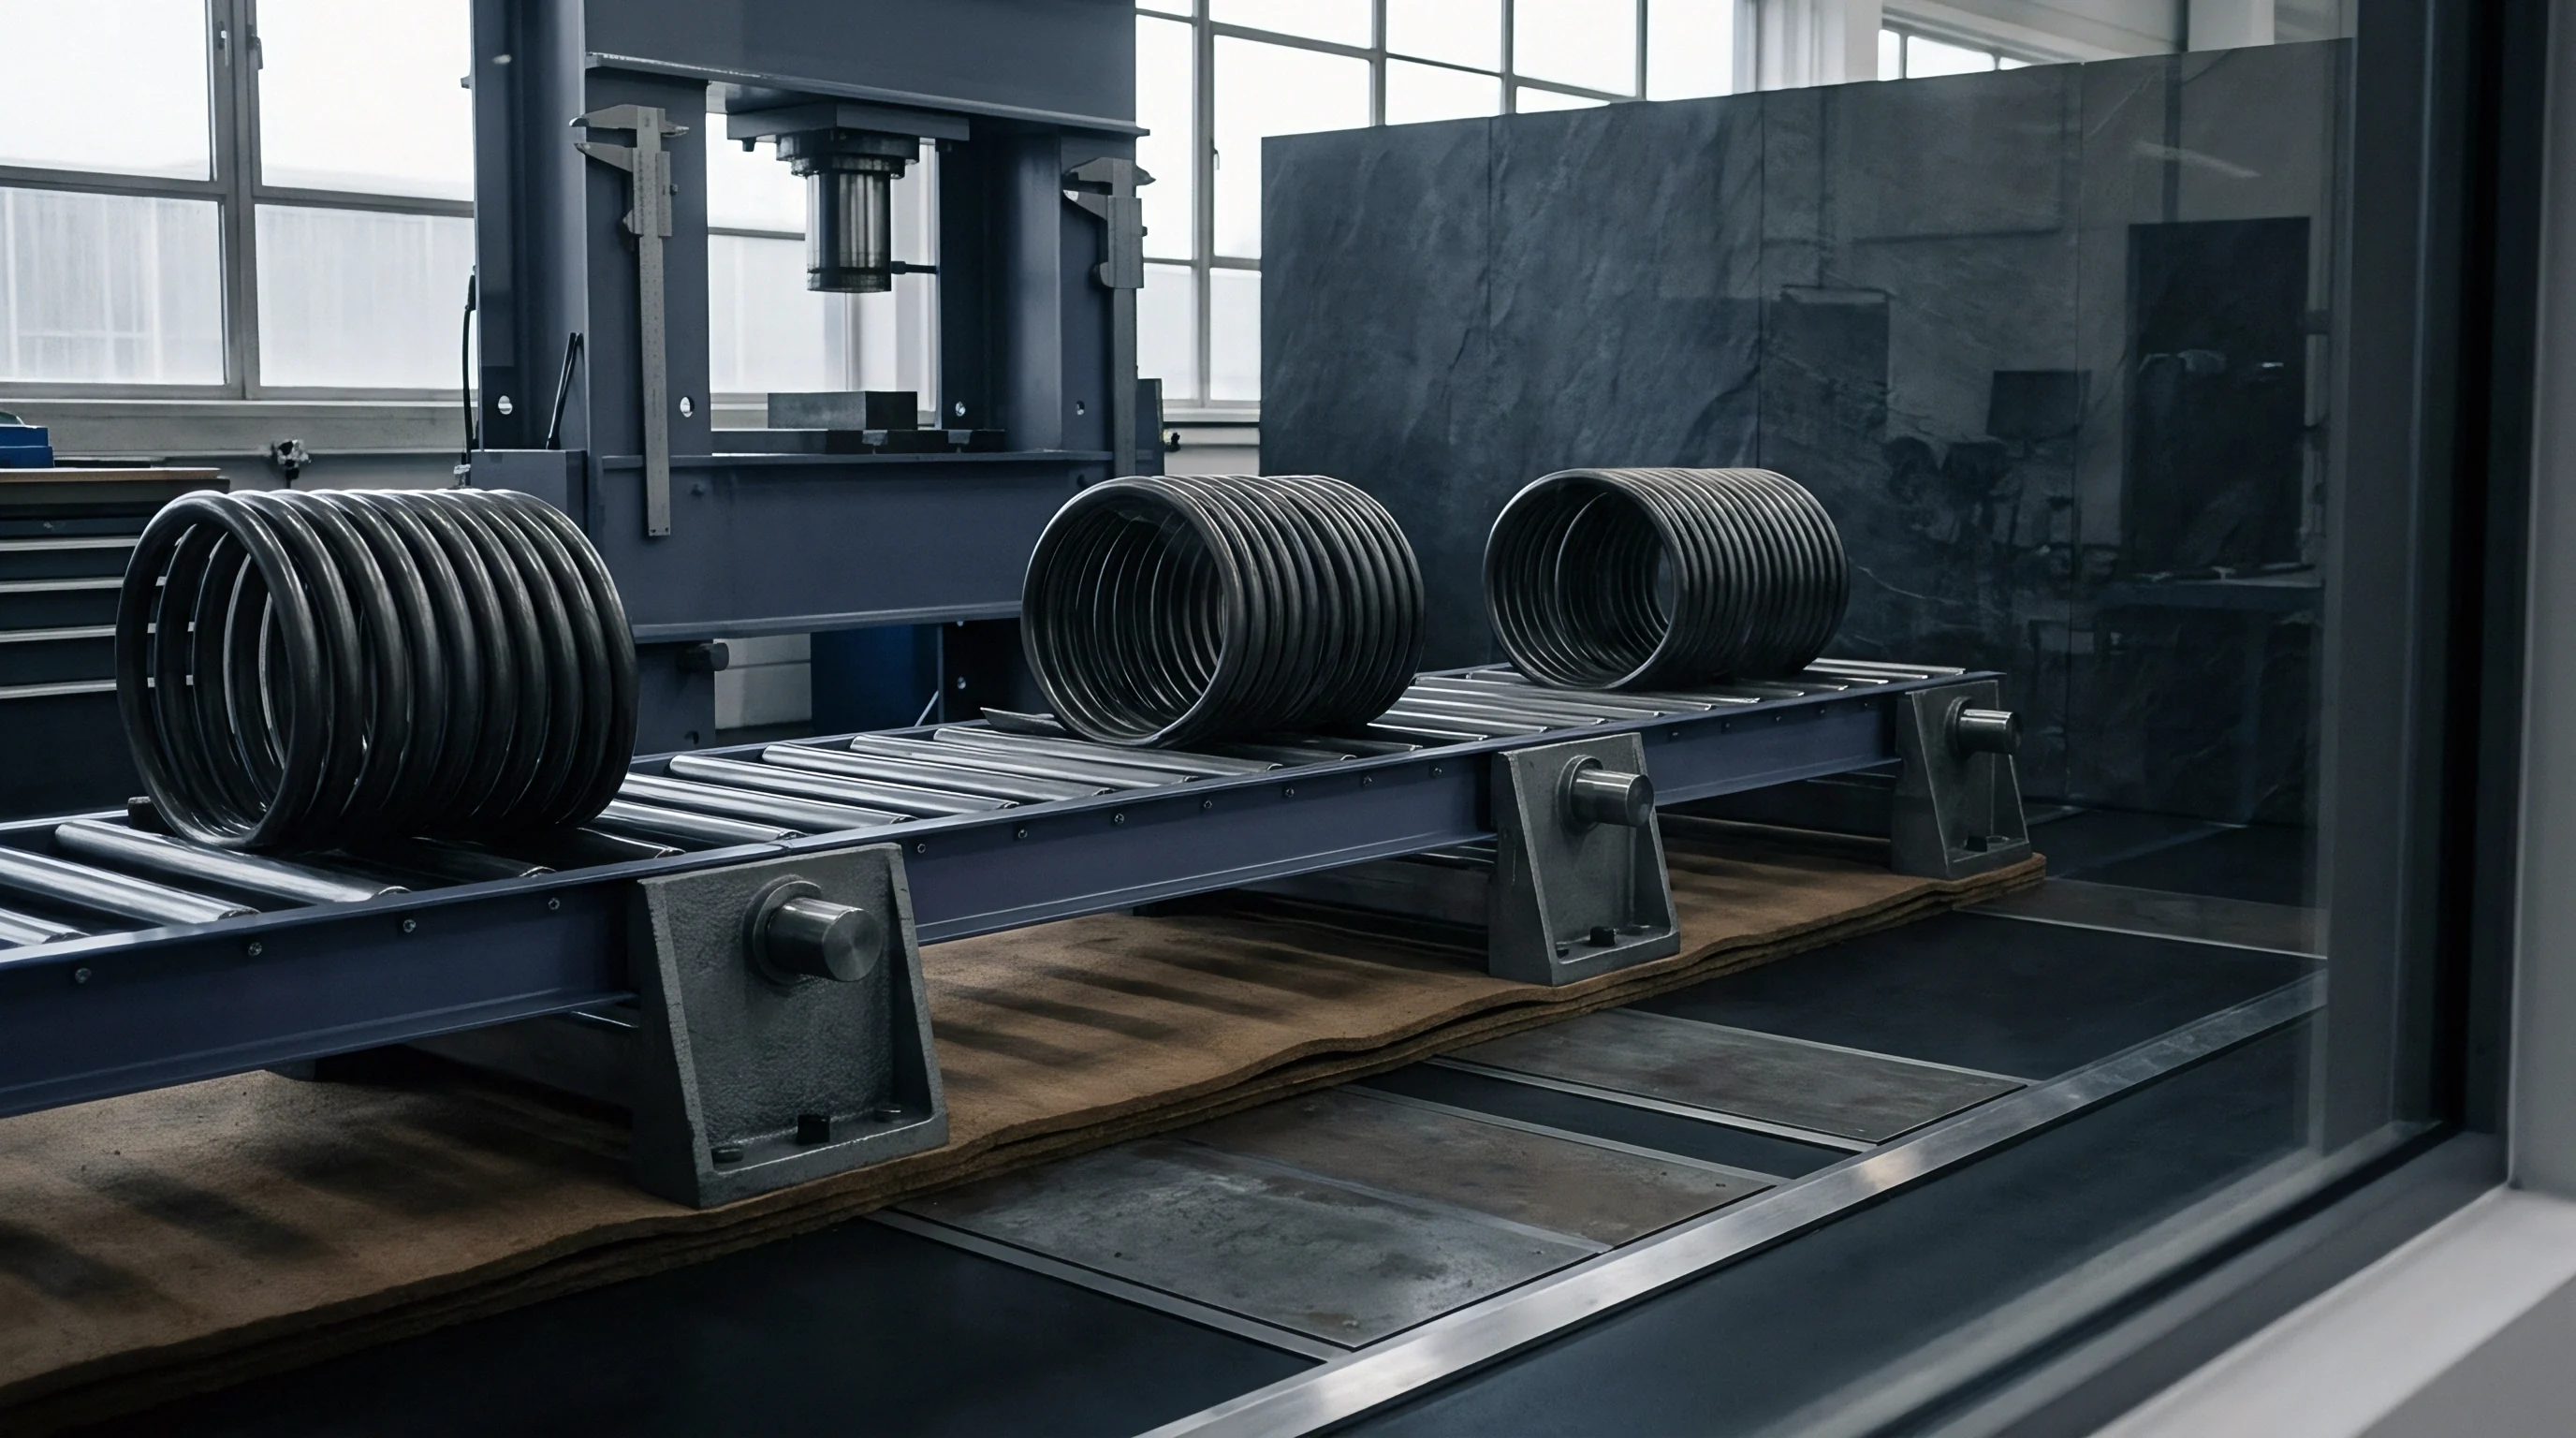
Belt
Line three at the secondary sorting spur shows four hundred totes backed up against zone four, while zone five runs completely dry. The physical drive rollers on zone four draw forty-two amperes against a thirty-ampere continuous rating, shedding friction lining across the snub pulley face. Conveyor systems rarely experience isolated component interruptions during high-volume run periods.
Mechanical strain in one conveyor module propagates directly into adjacent sections through payload backpressure, drive motor thermal loading, and line sensor blinding. When an accumulation zone stops due to a jammed tote shoe, upstream diverters continue pushing parcels into the deceleration transition until photo-eyes register full saturation.
Tension cables stretch under strain. Adjacent zones experience immediate physical changes when an upstream or downstream section halts. A blockage on zone four alters incoming package pitch, forcing zone three into continuous micro-stops rather than steady transit.
These micro-stops cycle the variable frequency drives between zero and sixty hertz every eight seconds, generating localized thermal spikes within drive electronics and gearboxes. The mechanical link between conveyor segments transforms localized friction anomalies into multi-zone failure clusters.
Coupled electromechanical drives convert single-point package jams into simultaneous thermal overloads across adjoining transport zones.
Sensors drift out of calibration. Photoelectric emitter-receiver pairs gather fine cardboard dust and polyethylene particulate during sustained accumulation episodes. When zone four stalls and totes pack rim-to-rim, sensor lenses in zone three receive heavy vibration from pneumatic pop-up stops engaging under load.
Optical misalignment follows mechanical deflection within fifteen operating hours. A single mechanical jam creates optical degradation across three upstream zones, producing false occupancy signals long after mechanics clear the physical jam.
- Drive pulley slippage accelerates surface wear across snub rollers during prolonged payload deceleration events.
- Pneumatic diverter binding stems from pressure drops when multiple downstream cylinders fire concurrently during high-density package clearing routines.
- Photoelectric sensor occlusion results from airborne particulate settling on optical lenses during continuous line stoppage cycles.
- Roller bearing seizure develops from sustained radial overhung loads when stopped zones support stalled product weight without continuous rotation.
Electrical feeds compound physical linkage. Common bus architectures link motor controllers across consecutive zones, meaning voltage sags induced by a stalling motor in zone four degrade torque performance in zone five. The downstream belt experiences speed drops of up to eight percent during upstream stall events, increasing parcel slippage and belt surface heating.
Equipment vendors explain these concurrent stoppages away by claiming maintenance personnel simply failed to maintain uniform belt tensioning schedules during peak operational shifts.

Covariance
Programmable logic controller incident archives reveal that seventy-two percent of unpredicted conveyor line shutdowns involve two or more zones halting within ninety seconds of each other. Classical engineering diligence treats mean time between failures across individual conveyor zones as independent exponential variables. That mathematical convenience severely misrepresents operational line dynamics.
When zones share electrical distribution panels, compressed air loops, common control networks, and package transfers, their probability distributions of failure exhibit strong tail dependence.
Unscheduled stops cascade quickly. Copula functions model joint failure probabilities far more accurately than classical independent Poisson arrival assumptions. A Gumbel copula captures upper tail dependence, reflecting operational conditions where extreme strain events cause simultaneous zone trip-outs.
In contrast, Gaussian copula formulations systematically underestimate joint tail events, projecting line availability figures that prove unachievable during operational scale testing. Fitting historical incident logs into an Archimedean copula structure exposes high co-dependence parameters between mechanically adjacent transfer junctions.
Historical SCADA fault archives collected over eighteen operating months demonstrate a Gumbel upper tail correlation coefficient of zero point forty-six between adjacent diverter zones under peak seasonal loading.
The correlation parameter rests on eighteen months of SCADA fault logs across four continuous conveyor loops running eighty thousand parcels daily, where sampling intervals sat at one hundred milliseconds. A shift toward lighter corrugated parcels or reduced sorting speeds below two meters per second would lower this correlation figure toward zero point twenty-eight. Mathematical modeling of joint downtime duration demands careful parameter validation.
| Zone Pair Relationship | Observed MTBF (Hours) | Linear Correlation (Rho) | Gumbel Copula Parameter (Theta) | Simultaneous Down Probability |
|---|---|---|---|---|
| Infeed to Merge Zone | 42.6 | 0.31 | 1.44 | 0.082 |
| Merge to Sorter Infeed | 28.4 | 0.58 | 2.15 | 0.174 |
| Sorter Transfer to Accumulation | 36.1 | 0.49 | 1.88 | 0.138 |
| Accumulation to Spiral Chute | 51.2 | 0.22 | 1.26 | 0.049 |
| Takeaway to Outfeed Bed | 64.0 | 0.18 | 1.18 | 0.031 |
Cycle time expands rapidly. Analytical queueing models using uncorrelated renewal processes generate buffer estimates that collapse under empirical operational verification. When failure events cluster, mean time to repair inflates because maintenance technicians must address mechanical binding on one zone while concurrently clearing control errors on another.
The duration of joint line outages increases by forty-five percent compared to isolated component repairs. The exact threshold where control software latency transitions from passive tracking delay to active failure propagation remains an open inquiry in line telemetry research.


Accumulation
Static buffers fail here. Sizing an intermediate conveyor accumulation buffer using single-station queuing formulas results in line starvation upstream and severe payload blocking downstream. When zone two and zone three experience correlated failure events, the intermediate buffer must absorb incoming units without back-pressuring the upstream sorter while maintaining discharge flow toward downstream packaging spurs.
A buffer engineered purely for independent random stops exhausts its holding capacity within the initial three minutes of a correlated outage event.

Where Do Interzone Jam Correlations Penetrate Buffer Depth?
Cascading stoppages penetrate accumulation buffers through dynamic wave propagation. When downstream takeaways fail, the accumulation zone switches from transport velocity to zero speed through segmented slug indexing. Shockwaves move upstream at velocities determined by photoelectric sensor pitch and brake engagement speeds.
If the upstream feeder fails concurrently, the buffer discharges remaining inventory without replenishment, leaving downstream sortation lines starved for product when maintenance restores downstream operations. Buffer utilization profiles shift from normal distributions into bifurcated bimodal distributions characterized by empty tracks or completely saturated rollers.
Under Section 7.3 of the CEMA 401 standard for continuous conveyor integration, mechanical accumulation zones operating without positive mechanical separation must maintain twenty-five percent excess physical pitch to absorb dynamic brake stopping slip.
Modern automated material handling mirrors high-frequency power distribution grids, where local impedance mismatches cause phase shifts that destabilize adjacent transmission substations. Conveyor belts carry kinetic momentum and discrete physical masses rather than electrical current, yet both systems suffer catastrophic capacity loss when localized damping fails to suppress oscillating surges. Downstream stations starve immediately.
| Buffer Configuration | Nominal Capacity (Totes) | Simulated Availability (Independent) | Measured Availability (Correlated) | Starvation Frequency (Shifts) |
|---|---|---|---|---|
| Zero-Pressure Singulated | 45 | 98.4% | 89.1% | 4.2 |
| Dynamic Slug Indexing | 80 | 99.1% | 93.4% | 2.1 |
| Recirculating Loop Buffer | 120 | 99.6% | 97.8% | 0.6 |
| Spiral Gravity Accumulator | 160 | 99.8% | 98.9% | 0.2 |
Line designers evaluate buffer readiness through structured sequence progression.
- Transient fault logging identifies the specific duration and frequency of simultaneous zone stops from raw PLC event strings.
- Copula model calibration fits empirical failure intervals into non-linear joint dependency distributions to establish real joint outage durations.
- Dynamic queue simulation runs correlated failure profiles through discrete-event line representations to establish true starving and blocking probability limits.
- Physical envelope appraisal determines whether the building footprint accommodates calculated accumulation footprints without restricting maintenance egress corridors.
Throughput drops below target. Operational stability dictates that accumulation buffer capacity should equal the downstream recovery cycle duration multiplied by upstream arrival velocity whenever joint failure correlations exceed zero point thirty.

Apportionment
Capital deployment decisions across automated conveyor systems hinge on where physical accumulation capacity generates the greatest operational protection per unit of expenditure. Allocating capital expenditure uniformly across all interzone junctions produces poor capital efficiency. Zone pairs with low failure correlation require minimal intermediate buffering, while junctions exhibiting high failure correlation and severe downtime covariance demand aggressive accumulation investments.
Sound allocation strategies frame buffer capacity as a discrete mathematical optimization problem constrained by capital ceilings, floor loading limits, and target system availability metrics.
Capital sits tied in steel. Consider a concrete operational expansion scenario. Assume a multi-zone conveyor network handling five thousand totes per hour across four distinct processing zones.
Zone one serves induction, zone two handles optical scanning, zone three manages dynamic sortation, and zone four conducts manual palletizing. Independent availability calculations estimate overall line uptime at ninety-six point two percent with minimal buffering, requiring a capital expenditure of one hundred and twenty thousand dollars for basic roller transport. Incorporating empirical joint failure correlation data drops projected line availability to eighty-seven point four percent unless engineers allocate supplementary buffer capacity.
The engineering team faces two capital allocation choices. Option Alpha distributes two hundred thousand dollars uniformly across three buffer locations, adding thirty tote positions between each processing zone. Option Beta deploys the same two hundred thousand dollars unevenly: ten tote positions between zones one and two, sixty tote positions between zones two and three where failure correlation hits zero point fifty-eight, and twenty tote positions between zones three and four.
Option Beta achieves ninety-six point eight percent real-world operational availability, whereas Option Alpha reaches only ninety-one point two percent because correlated jams between scanning and sortation regularly breach the thirty-tote buffer.
| Allocation Architecture | Total Buffer Capex ($) | Floor Space Footprint (Sq M) | Correlated Availability (%) | Throughput (Totes/Hr) |
|---|---|---|---|---|
| Baseline Uniform Zero-Buffer | 0 | 120 | 87.4% | 4,370 |
| Option Alpha (Uniform Buffers) | 200,000 | 210 | 91.2% | 4,560 |
| Option Beta (Covariance-Weighted) | 200,000 | 205 | 96.8% | 4,840 |
| Option Gamma (Maximized Decoupling) | 380,000 | 310 | 98.2% | 4,910 |
The desk cannot fully defend the assumption that installation labor scaling remains strictly linear across non-standard buffer geometries above forty linear meters. Buyers operating under this specific geometric uncertainty should retain a twelve percent contingency reserve against structural mezzanine modifications during mechanical installation. Site managers utilize defined validation gates prior to authorizing capital release.
- Covariance matrix verification confirms empirical statistical correlation between adjacent zones from historical programmable logic controller incident logs before mechanical sign-off.
- Floor load qualification validates that existing structural slabs carry dynamic weight profiles of saturated slug buffers during emergency stops.
- Energy envelope auditing ensures electrical distribution gear accommodates concurrent motor restart currents without tripping main supply breakers.
- Maintainability clearance screening establishes physical access aisles around expanded accumulation spirals for drive motor servicing.
The motor draws peak current. Allocating capital expenditure without accounting for failure covariance results in premature expenditure exhaustion on low-risk transfer points while starving high-risk junctions, leaving lines chronically vulnerable to multi-zone cascade shutdowns during peak operational periods.

Outlay
Commitment schedules for conveyor automation require dated capital stage gates directly tied to operational performance demonstrations. Financial officers frequently approve lump-sum procurement contracts that transfer financial risk to the buyer long before equipment demonstrates operational availability under full correlated stress. Conveyor equipment procurement demands progressive disbursement structures mapped to verified line decoupling capability.
The payload clears the gate. Initial expenditure commitments release funding strictly for baseline mechanical conveyance and primary structural steel. Engineering management holds secondary buffer capital in escrow until the integration team proves operational availability under simulated multi-zone jam conditions.
Equipment trials must test line resilience by inducing simultaneous stops across high-correlation zone pairs, measuring whether accumulation buffers absorb surge volume without forcing upstream shutdowns. Passing this test unlocks capital release for secondary sortation loops and automated recirculating accumulation zones.
Capital commitment structures tied to progressive factory acceptance testing reduce commercial exposure during post-commissioning facility ramp periods.
Static nameplate capacity claims from equipment vendors routinely overstate performance by fifteen to twenty-two percent because laboratory tests decouple zones under ideal feeding conditions. The published nameplate figures rest on single-belt trials conducted at standard ambient temperatures with uniform cardboard packaging running on pristine belts. Introducing mixed parcel dimensions, plastic totes with warped bottoms, and environmental dust causes zone stoppage correlations to rise rapidly, driving real throughput below target levels.
Financial exposure escalates when buyers sign off on milestone completions based on dry testing runs without live payload. Factory acceptance testing must replicate the joint failure distributions established during initial stochastic correlation analysis. Contracts should mandate that suppliers demonstrate continuous operation during induced twenty-minute simultaneous shutdowns of zones two and three, verifying that the intermediate buffer preserves upstream sorting velocity.
Under standard commercial terms governed by the FIDIC Yellow Book Conditions of Contract for Plant and Design-Build, incorporating Sub-Clause 9.4 enables the purchaser to withhold the operational handover certificate and levy delay damages until the automated conveyor network sustains its contractually stipulated throughput under verified correlated failure stress testing.