Photoelastic Stress Tensor Analysis in Thermally Loaded Laser Windows
Photoelastic tensor analysis maps laser-induced thermal stress fields to prevent optical path distortion and edge fracture in high-power transmissive optics.
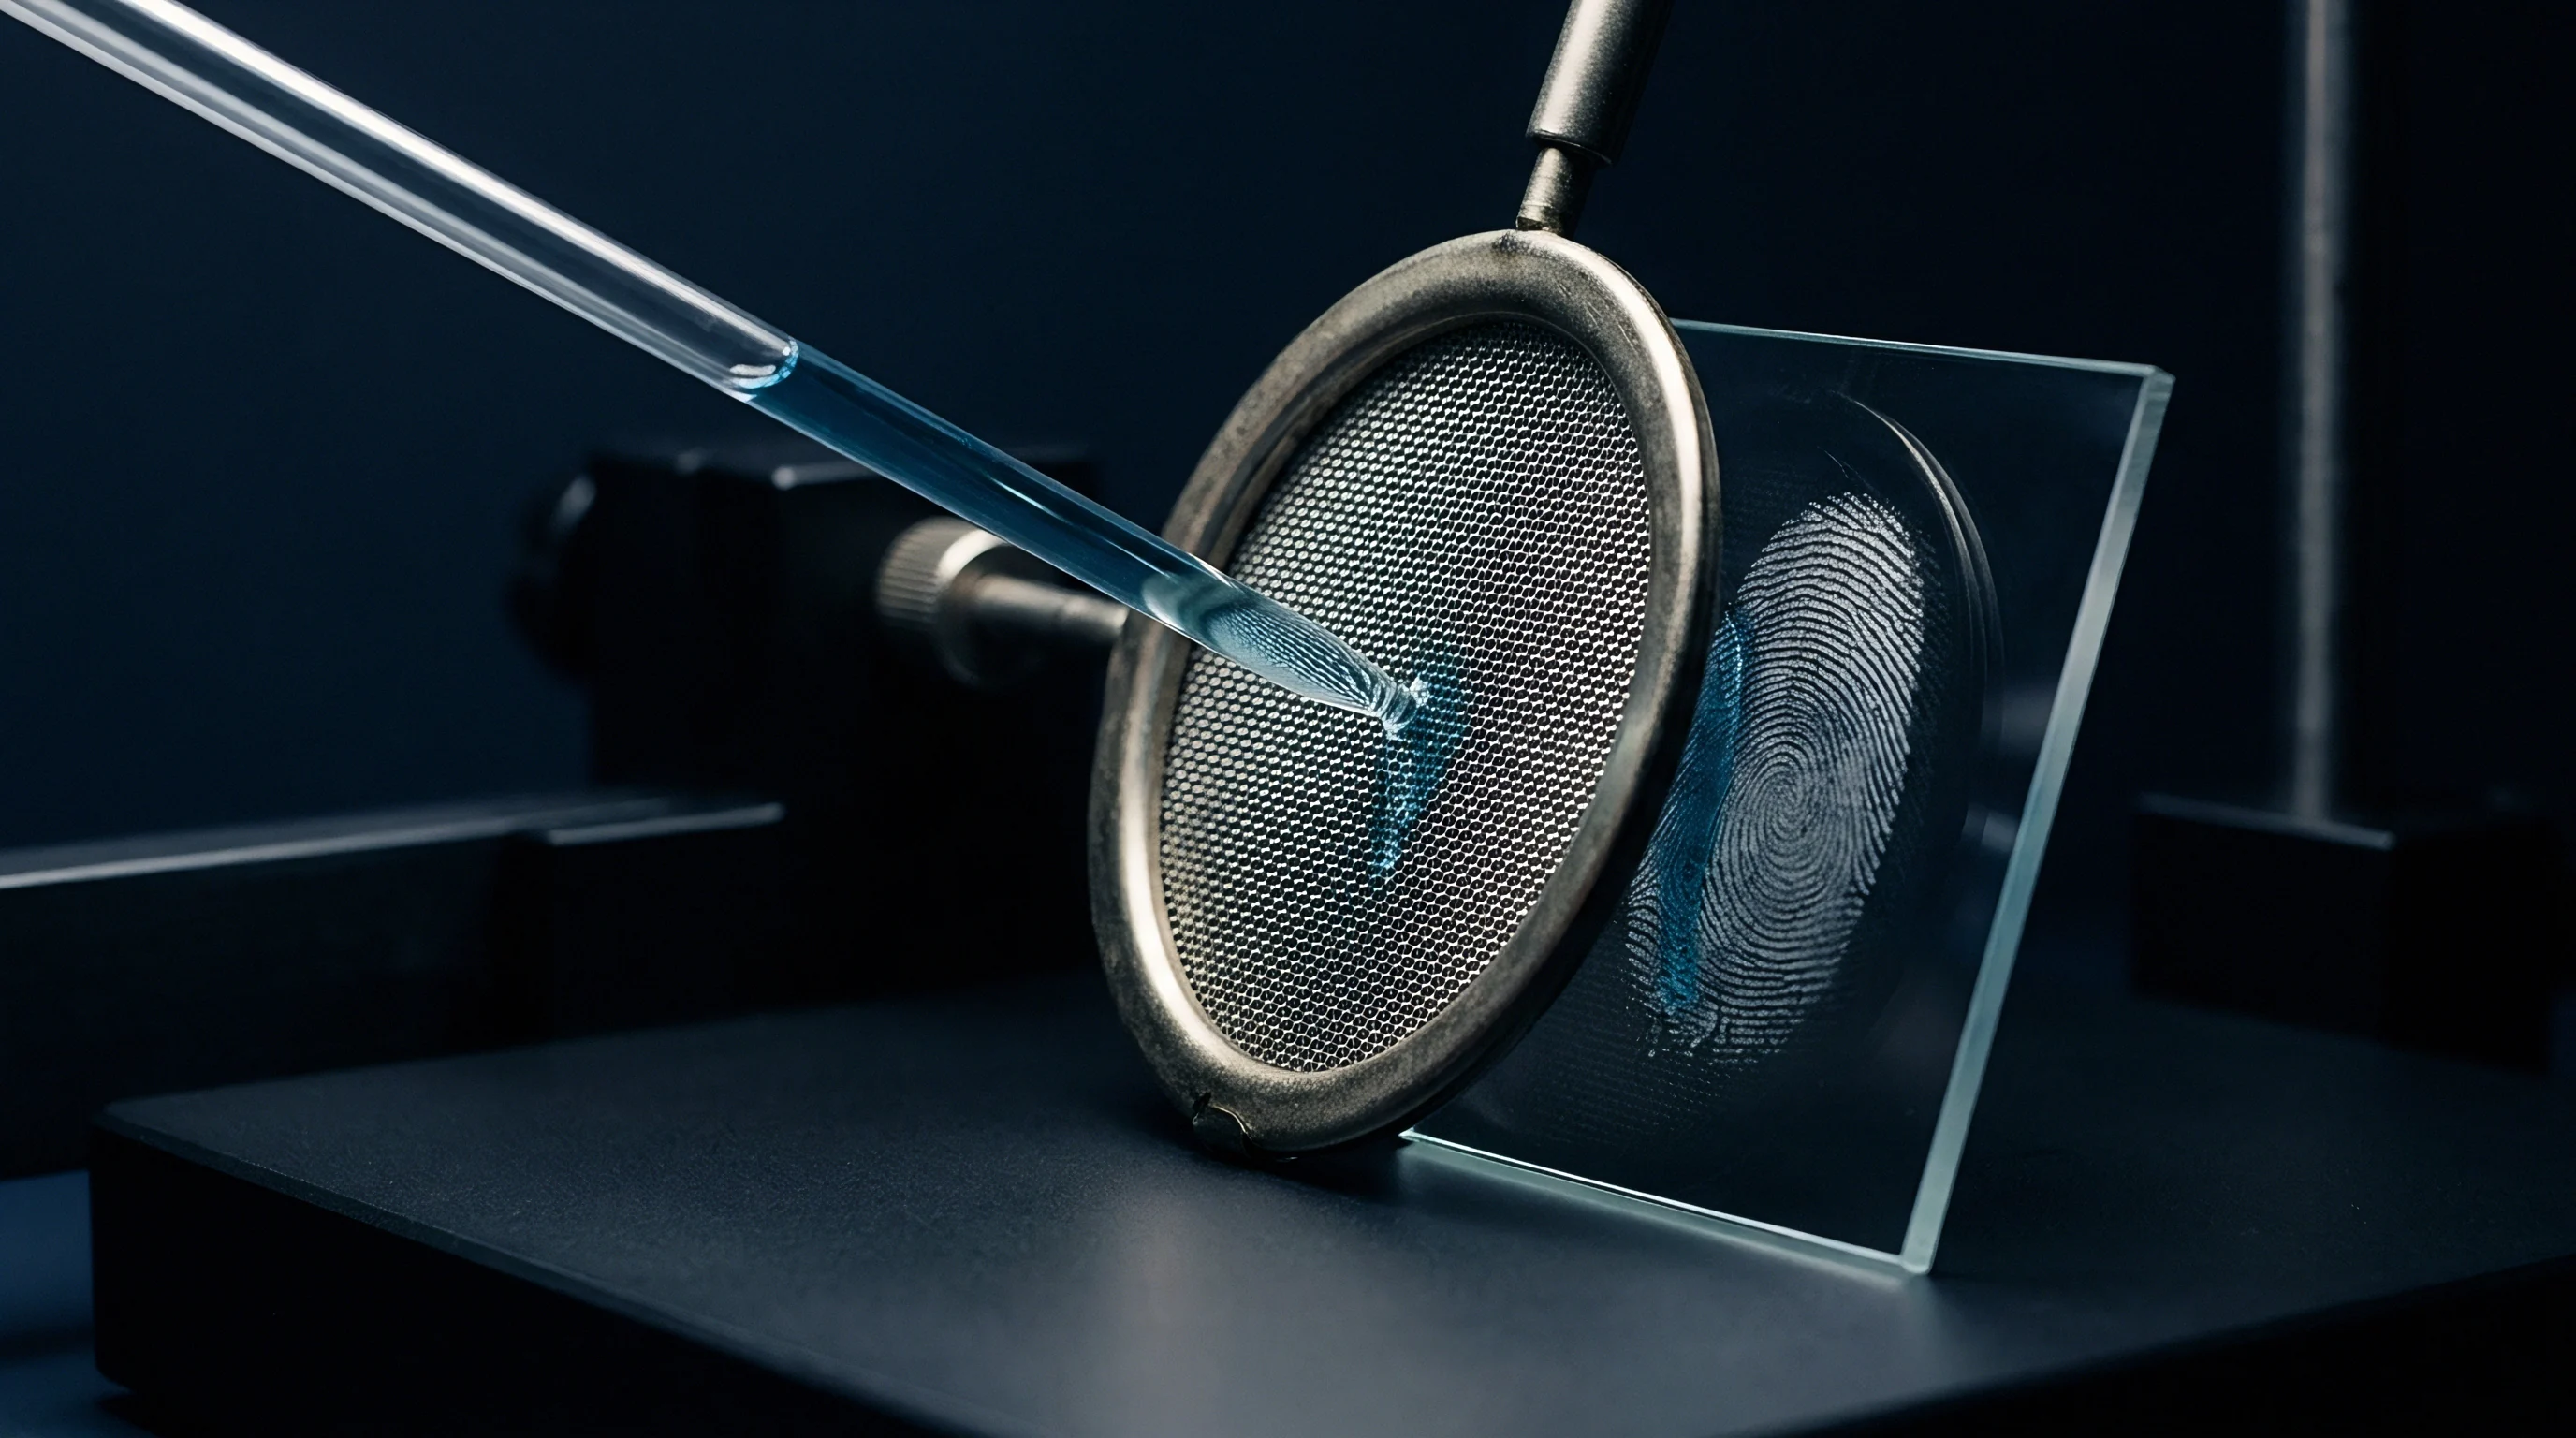

Fringe
High-energy beam passage generates localized thermal profiles inside solid dielectric media, producing spatial variation in the complex optical index matrix. Transmissive laser windows exposed to multikilowatt continuous-wave radiation absorb energy through bulk material loss and surface coating absorption. This non-uniform temperature field forces thermal expansion against surrounding cool substrate material, generating structural stresses across the optic aperture.
Stress tensor analysis relies on photoelasticity to visualize and quantify these internal forces before mechanical failure or unrecoverable wavefront aberration takes place.
Polarized illumination passing through an anisotropic stress field undergoes spatial decomposition into orthogonally polarized components. Optical anisotropy induced by mechanical stress transforms isotropic optical glass into a temporary birefringent medium. Measuring the resulting optical phase difference across the transmissive clear aperture exposes the magnitude and orientation of principal stress components.
High-power optical systems operate under tight wavefront error budgets where minor stress-induced optical retardance degrades focusability and alters polarization states.
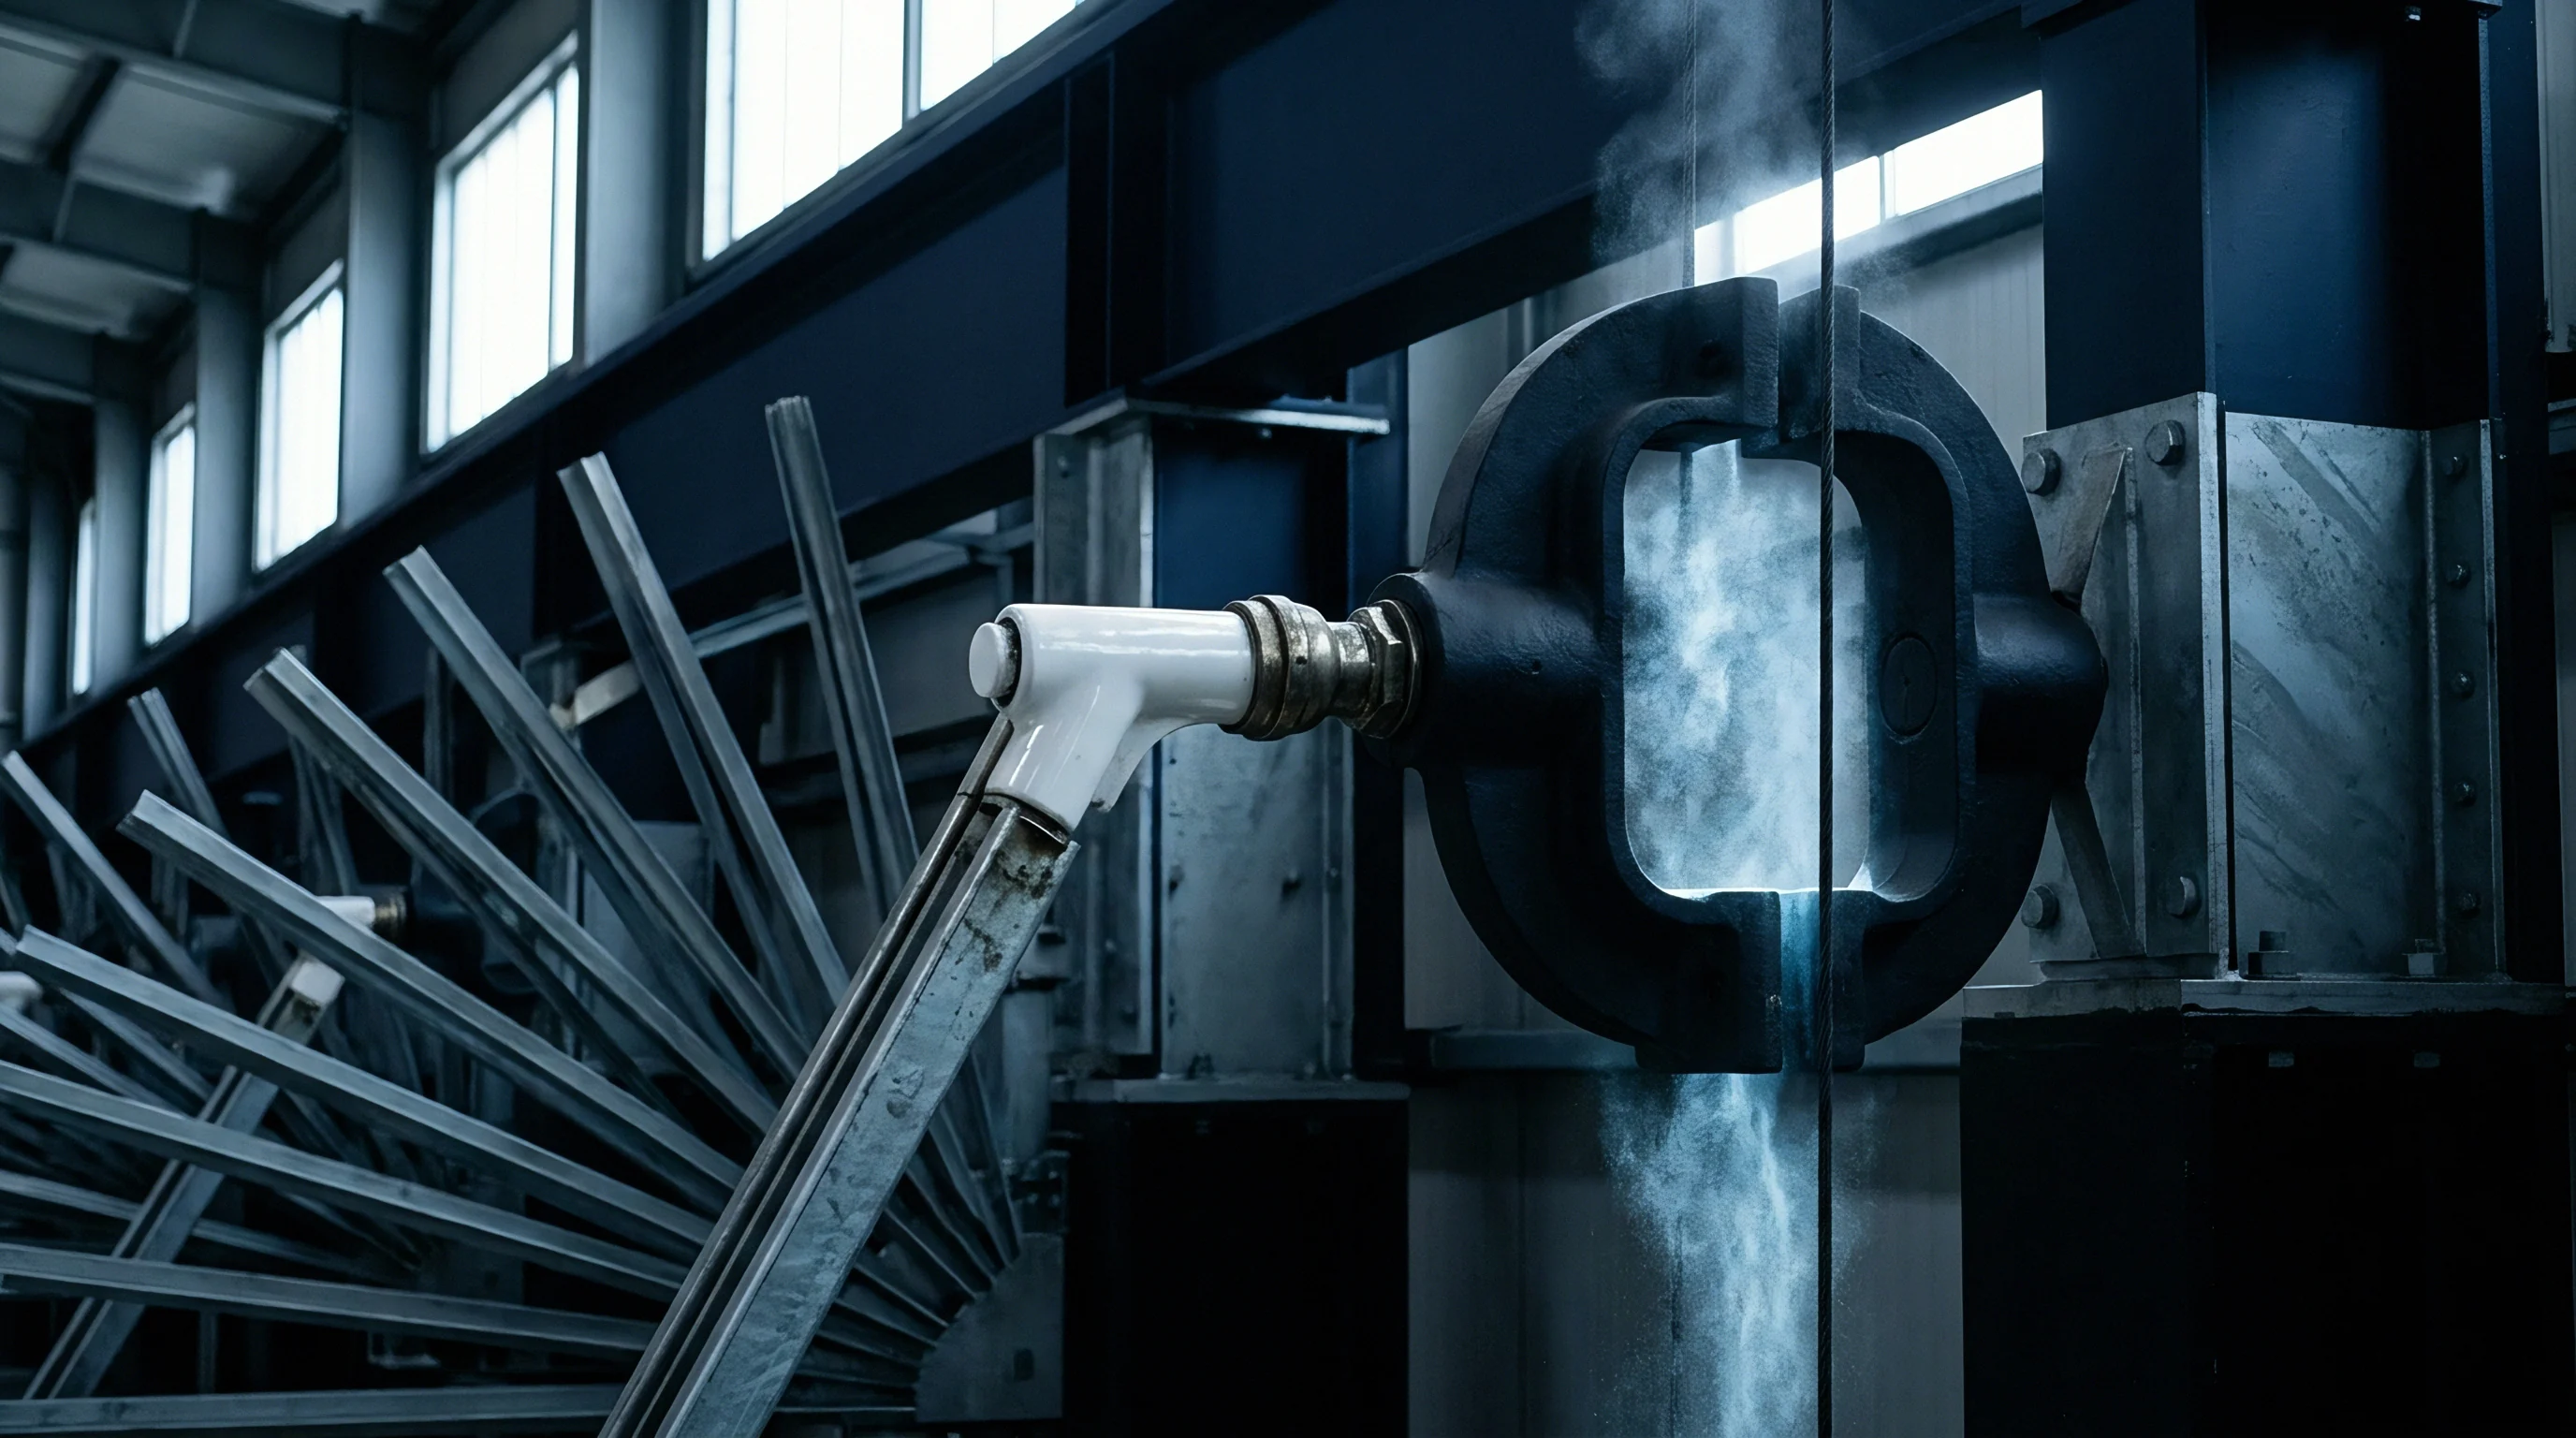
Laser Transmissive Components under Absorption Heat
Solid-state optics absorbing continuous-wave energy develop axisymmetric thermal gradients due to volumetric dissipation of electromagnetic fields. Continuous-wave laser industrial systems operating between one kilowatt and twenty kilowatts rely on materials like fused silica, zinc selenide, calcium fluoride, or single-crystal sapphire. Material absorption coefficients range from below one part per million per centimeter in ultra-pure synthetic fused silica to higher values in infrared transmissive optics.
Absorbed laser energy elevates the core temperature while outer edges lose heat to water-cooled mechanical mounts.
Edge fracture halts laser operations. Heat accumulation alters refractive index. Tensile stress concentrations at outer clear apertures drive crack propagation when mechanical stress exceeds substrate yield points.
The localized thermal profile exhibits a central peak corresponding to the Gaussian power distribution of the incident laser beam. Edge-cooled boundary conditions establish steep radial thermal gradients between the beam center and the clamped circumference.
A high-purity fused silica window loaded at ten kilowatts continuous-wave beam power exhibits a maximum differential thermal expansion stress of 14.2 megapascals at a fifty-millimeter radial distance.
Photoelastic Fringe Pattern Generation Mechanics
Polarized illumination passing through an anisotropic stress field undergoes spatial decomposition into orthogonally polarized components with distinct phase velocities. Polarimetry setups capture these phase variations as optical interference fringe patterns. Isochromatic fringes trace contours of constant principal stress difference, whereas isoclinic fringes identify regions where principal stress directions align with the transmission axes of the polarizers.
Optical fringe density scales directly with beam intensity, substrate thickness, and the material stress-optic coefficient. High fringe orders signal elevated strain energy densities near edge boundaries or localized absorption sites. Circular polariscope configurations isolate isochromatic fringes by eliminating directional dependence, allowing automated image analysis systems to map principal stress fields across the entire clear aperture.
Thermally loaded windows continuously redistribute strain distributions across the beam clear aperture during long continuous-wave exposures.


Tensor
Axisymmetric thermal fields within cylindrical glass disks give rise to non-uniform volumetric expansion, driving mechanical constraints across concentric annular zones. Calculating the complete stress state requires solving the thermoelastic governing equations under plane stress conditions for thin windows or plane strain conditions for thick optical elements. The resulting stress field contains radial stress, circumferential stress, and axial stress components that vary across the disk radius.
Thermal stress components couple directly to the dielectric impermeability tensor through the stress-optic matrix. In an unstressed state, isotropic optical glass possesses a spherical optical indicatrix representing uniform refractive index in all spatial directions. Application of a non-uniform thermal stress field deforms this sphere into a triaxial ellipsoid, splitting the single refractive index into distinct principal refractive indices aligned with the principal stress directions.
Thermoelastic Stress Field Formulation
Radial temperature gradients generate compressive forces within heated beam centers while inducing circumferential tension near unexposed outer rims. Assuming an axisymmetric Gaussian laser profile, the steady-state temperature profile T(r) serves as the driving term in Plane Stress Elasticity equations. Radial stress sigma_r and circumferential stress sigma_theta are derived from the temperature field using integral strain formulation.
Thermal gradients drive mechanical strain. Stress field gradients distort wavefronts. Radial stress remains compressive across the central region, reaching zero at the outer edge boundary where no mechanical restraint exists.
Circumferential stress transitions from central compression to maximum tensile stress at the outer cooled rim. The mathematical expressions governing these internal stress states follow clear integral expressions based on thermal expansion coefficient alpha, Young’s modulus E, and Poisson’s ratio nu:
sigma_r(r) = (alpha E / 2)
sigma_theta(r) = (alpha E / 2)
Here T_bar(r) represents the average temperature inside radius r, and T_bar(R) represents the average temperature across the entire window radius R. The principal stress difference, which governs photoelastic retardance, simplifies to a direct function of localized temperature variation:
sigma_r(r) – sigma_theta(r) = alpha E
Stress-Optic Coefficient Tensor Decomposition
Piezo-optic matrix components link mechanical strain states directly to modifications in the material optical index ellipsoid. For isotropic materials, the stress-optic tensor contains two independent fundamental constants: c1, representing parallel polarization stress-optic shift, and c2, representing perpendicular polarization shift. The differential stress-optic coefficient C, often designated in photoelastic literature as the photoelastic constant, equals c1 minus c2.
Refractive index modifications delta_n_r and delta_n_theta along radial and circumferential axes depend directly on principal stress magnitudes. The photoelastic stress equations map mechanical stress values into refractive index changes that dictate optical path variations:
delta_n_r = c1 sigma_r + c2 (sigma_theta + sigma_z)
delta_n_theta = c1 sigma_theta + c2 (sigma_r + sigma_z)
delta_n_r – delta_n_theta = (c1 – c2) (sigma_r – sigma_theta) = C (sigma_r – sigma_theta)
Consider a concrete worked calculation for a high-power laser transmission system. Assume a 100-millimeter diameter synthetic fused silica window with a 10-millimeter thickness absorbing 15 watts of continuous-wave laser power from a 10-kilowatt Gaussian beam. The material parameters are specified as follows: thermal conductivity k = 1.38 W/(m K), coefficient of thermal expansion alpha = 0.55 x 10^-6 K^-1, Young’s modulus E = 73 GPa, Poisson’s ratio nu = 0.17, and stress-optic coefficient C = 3.5 x 10^-12 Pa^-1.
Calculating the core temperature rise against the outer perimeter yields a peak central temperature elevation T(0) – T(R) of 28.4 Kelvin under steady-state heat extraction. Substituting these values into the thermoelastic stress integral yields a central compressive stress of -2.03 MPa for both radial and circumferential components. At the outer clear radius (r = 50 mm), radial stress drops to 0 MPa, while circumferential stress reaches a peak tensile value of +2.03 MPa.
At an intermediate radial distance of 20 mm, the calculated radial stress equals -1.25 MPa and circumferential stress equals +0.45 MPa, producing a principal stress difference of -1.70 MPa. Multiplying this stress difference by the 10-millimeter thickness and stress-optic constant C produces an optical path retardation of 59.5 nanometers at that specific radial position.
Mechanisms driving optical failure under severe thermal loading include:
- Edge Cleavage Fracture occurring when circumferential tensile stress exceeds the polished surface micro-crack strength threshold of the optical glass edge.
- Polarization Depolarization resulting from spatially varying principal stress axes that alter the linear polarization purity of high-power laser beams.
- Thermal Lensing Focus Shift caused by non-uniform refractive index expansion coupled with stress-induced optical retardance across the beam aperture.
- Coating Delamination driven by shear stress mismatch at the interface between dielectric thin-film coatings and the expanding substrate material.
| Material Substrate | Thermal Conductivity (W/m K) | Thermal Expansion (10^-6 /K) | Young’s Modulus (GPa) | Stress-Optic Constant C (10^-12 Pa^-1) | Critical Tensile Yield (MPa) |
|---|---|---|---|---|---|
| Synthetic Fused Silica | 1.38 | 0.55 | 73.0 | 3.50 | 48.0 |
| Zinc Selenide (CVD) | 18.00 | 7.60 | 67.2 | -11.50 | 20.0 |
| Sapphire (c-cut) | 35.00 | 5.00 | 345.0 | 1.45 | 275.0 |
| Calcium Fluoride | 9.70 | 18.80 | 75.8 | -0.85 | 15.0 |
Ignoring thermoelastic stress tensor components during window selection leads directly to unpredicted optical depolarization, focal spot distortion, and structural fracture during full-power operation.


Retardation
Phase differences accumulated between orthogonal polarization axes convert isotropic substrates into functional waveplates under thermal loading. Optical retardance delta represents the accumulated optical path difference between fast and slow light wave propagation across the substrate thickness d. Precise extraction of retardance profiles allows engineers to invert optical measurement data and reconstruct the underlying principal stress field.
Polarimetric analysis converts phase retardation measurements into precise stress tensor values. Because optical retardance integrates stress along the optical propagation axis z, polarimetric systems yield depth-averaged principal stress magnitudes. High-precision laser applications require sub-nanometer retardation resolution to detect early-stage thermal accumulation before wavefront degradation compromises process efficiency.

Senarmont Polarimetry and Isoclinic Mapping
Quantitative instruments evaluate differential optical paths through precise angle adjustment of a rotating quarter-wave element. The Senarmont compensation method pairs a linear polarizer, a quarter-wave plate oriented at 45 degrees relative to the principal stress axis, and a rotating analyzer. Adjusting the analyzer angle isolates the phase retardance value with high numerical precision.
Automated polarimeters replace manual compensation with rotating polarizer-analyzer setups or electro-optic phase modulation. Spatial light detectors map intensity variations across millions of pixels, calculating phase retardation delta(x,y) and principal stress direction theta(x,y) at every discrete point. Polarized light reveals hidden strains.
Phase retardance calculation follows the standard photoelastic equation:
delta(x,y) = (2 pi / lambda) C d
where lambda represents illumination wavelength, d represents optic thickness, C represents stress-optic coefficient, and sigma_1 minus sigma_2 represents the principal stress difference.

Where Do Isoclinic and Isochromatic Measurements Diverge?
Polarized light fields differentiate spatial stress directionality from principal stress amplitude through distinct optical intensity nulls. Isoclinic patterns emerge when principal stress orientation matches the polarizer transmission axis, producing dark fringe bands regardless of phase retardance magnitude. Isochromatic patterns represent constant phase retardation levels corresponding directly to stress difference contours.
ISO 11455 compliance mandates optical path retardance verification below two nanometers per millimeter of glass thickness to prevent localized focus shifts.
Separating these two signal components requires multi-wavelength illumination or phase-shifting polarimetry. Phase-shifting methodology captures six to sixteen distinct intensity images at controlled polarizer waveplate angles. Mathematical phase unwrapping algorithms separate directional orientation angle theta from retardation magnitude delta, preventing optical artifacts near zero-stress neutral zones.
Material vendors routinely assert that bulk birefringence ratings guarantee optical performance without accounting for mounting strain or thermal absorption.


Distortion
Thermal expansion and index variations alter wavefront shapes, degrading beam quality during high-power laser transmission. Thermo-optic distortive effects combine three distinct physical phenomena: refractive index change with temperature dn/dT, physical surface bulge caused by thermal expansion alpha, and stress-induced optical birefringence driven by photoelastic coefficients. Characterizing total optical path difference requires combining mechanical deformation models with stress tensor fields.
Wavefront distortion compromises laser focusing characteristics, spreading beam focus energy and reducing peak power density. In material processing applications, beam beam quality degradation reduces cut speeds and increases heat-affected zone dimensions. In optical defense systems or high-energy physics, thermo-optic distortion disrupts target illumination accuracy and optical transport throughput.
Thermo-Optic Lensing and Birefringence Aberrations
Temperature dependent refractive changes combine with strain-induced phase splits to shift focus locations and compromise spatial beam profiles. Thermo-optic coefficient dn/dT dominates thermal lensing in materials like fused silica and zinc selenide. As the center of the window heats up relative to the edge, the refractive index increases centrally, creating a positive thermal lens that pulls the focal plane closer to the optical assembly.
Thermal lensing shifts focal planes. Circumferential tension drives edge cracking. Photoelastic anisotropy introduces astigmatism and polarization-dependent focus splitting.
Radial and circumferential polarization components experience different optical paths, causing radial polarization to focus at a different position along the optical axis than circumferential polarization.
Radial compressive stress increases window mechanical stability while circumferential tensile stress drives edge failure.

Optical Path Difference Numerical Integration
Calculated wavefront modifications sum temperature coefficients, physical disk growth, and photoelastic index offsets across the component thickness. Integrating these effects along the beam path length z yields the total optical path difference profile OPD(r) for radial and circumferential polarization orientations:
OPD_r(r) = d
OPD_theta(r) = d
Quantifying total wavefront phase error across a thermally loaded optical window involves a sequential computational procedure:
- Calculate spatial temperature field T(r,z) by solving steady-state thermal conduction equations driven by volumetric beam power absorption.
- Compute strain and stress tensor fields sigma_r(r), sigma_theta(r), and sigma_z(r) using finite element analysis or thermoelastic integral equations.
- Determine localized principal refractive index modifications delta_n_r and delta_n_theta across the disk aperture.
- Integrate optical path changes across thickness d to calculate polarized wavefront distributions OPD_r(r) and OPD_theta(r).
- Decompose calculated optical path difference profiles into standard Zernike polynomial coefficients to quantify spherical aberration, focus shift, and astigmatism.
| Parameter Component | Fused Silica Value | Zinc Selenide Value | Physical Mechanism Source |
|---|---|---|---|
| Refractive Index Change (dn/dT) | +1.00 x 10^-5 K^-1 | +6.10 x 10^-5 K^-1 | Temperature-dependent index variation |
| Surface Bulge Term | +0.23 x 10^-5 K^-1 | +1.06 x 10^-5 K^-1 | Unconstrained axial thermal expansion |
| Photoelastic Radial Term | -0.08 x 10^-5 K^-1 | -0.42 x 10^-5 K^-1 | Compressive radial stress field shift |
| Photoelastic Circumferential Term | +0.12 x 10^-5 K^-1 | -0.85 x 10^-5 K^-1 | Tensile circumferential stress field shift |
| Net Focal Power Shift (Diopters) | +0.14 m^-1 | +1.85 m^-1 | Total integrated thermo-optic defocus |
The precise transition boundary where thermo-optic wavefront phase distortion overshadows stress-induced polarization depolarization remains uncertain across non-uniform laser beam profiles.
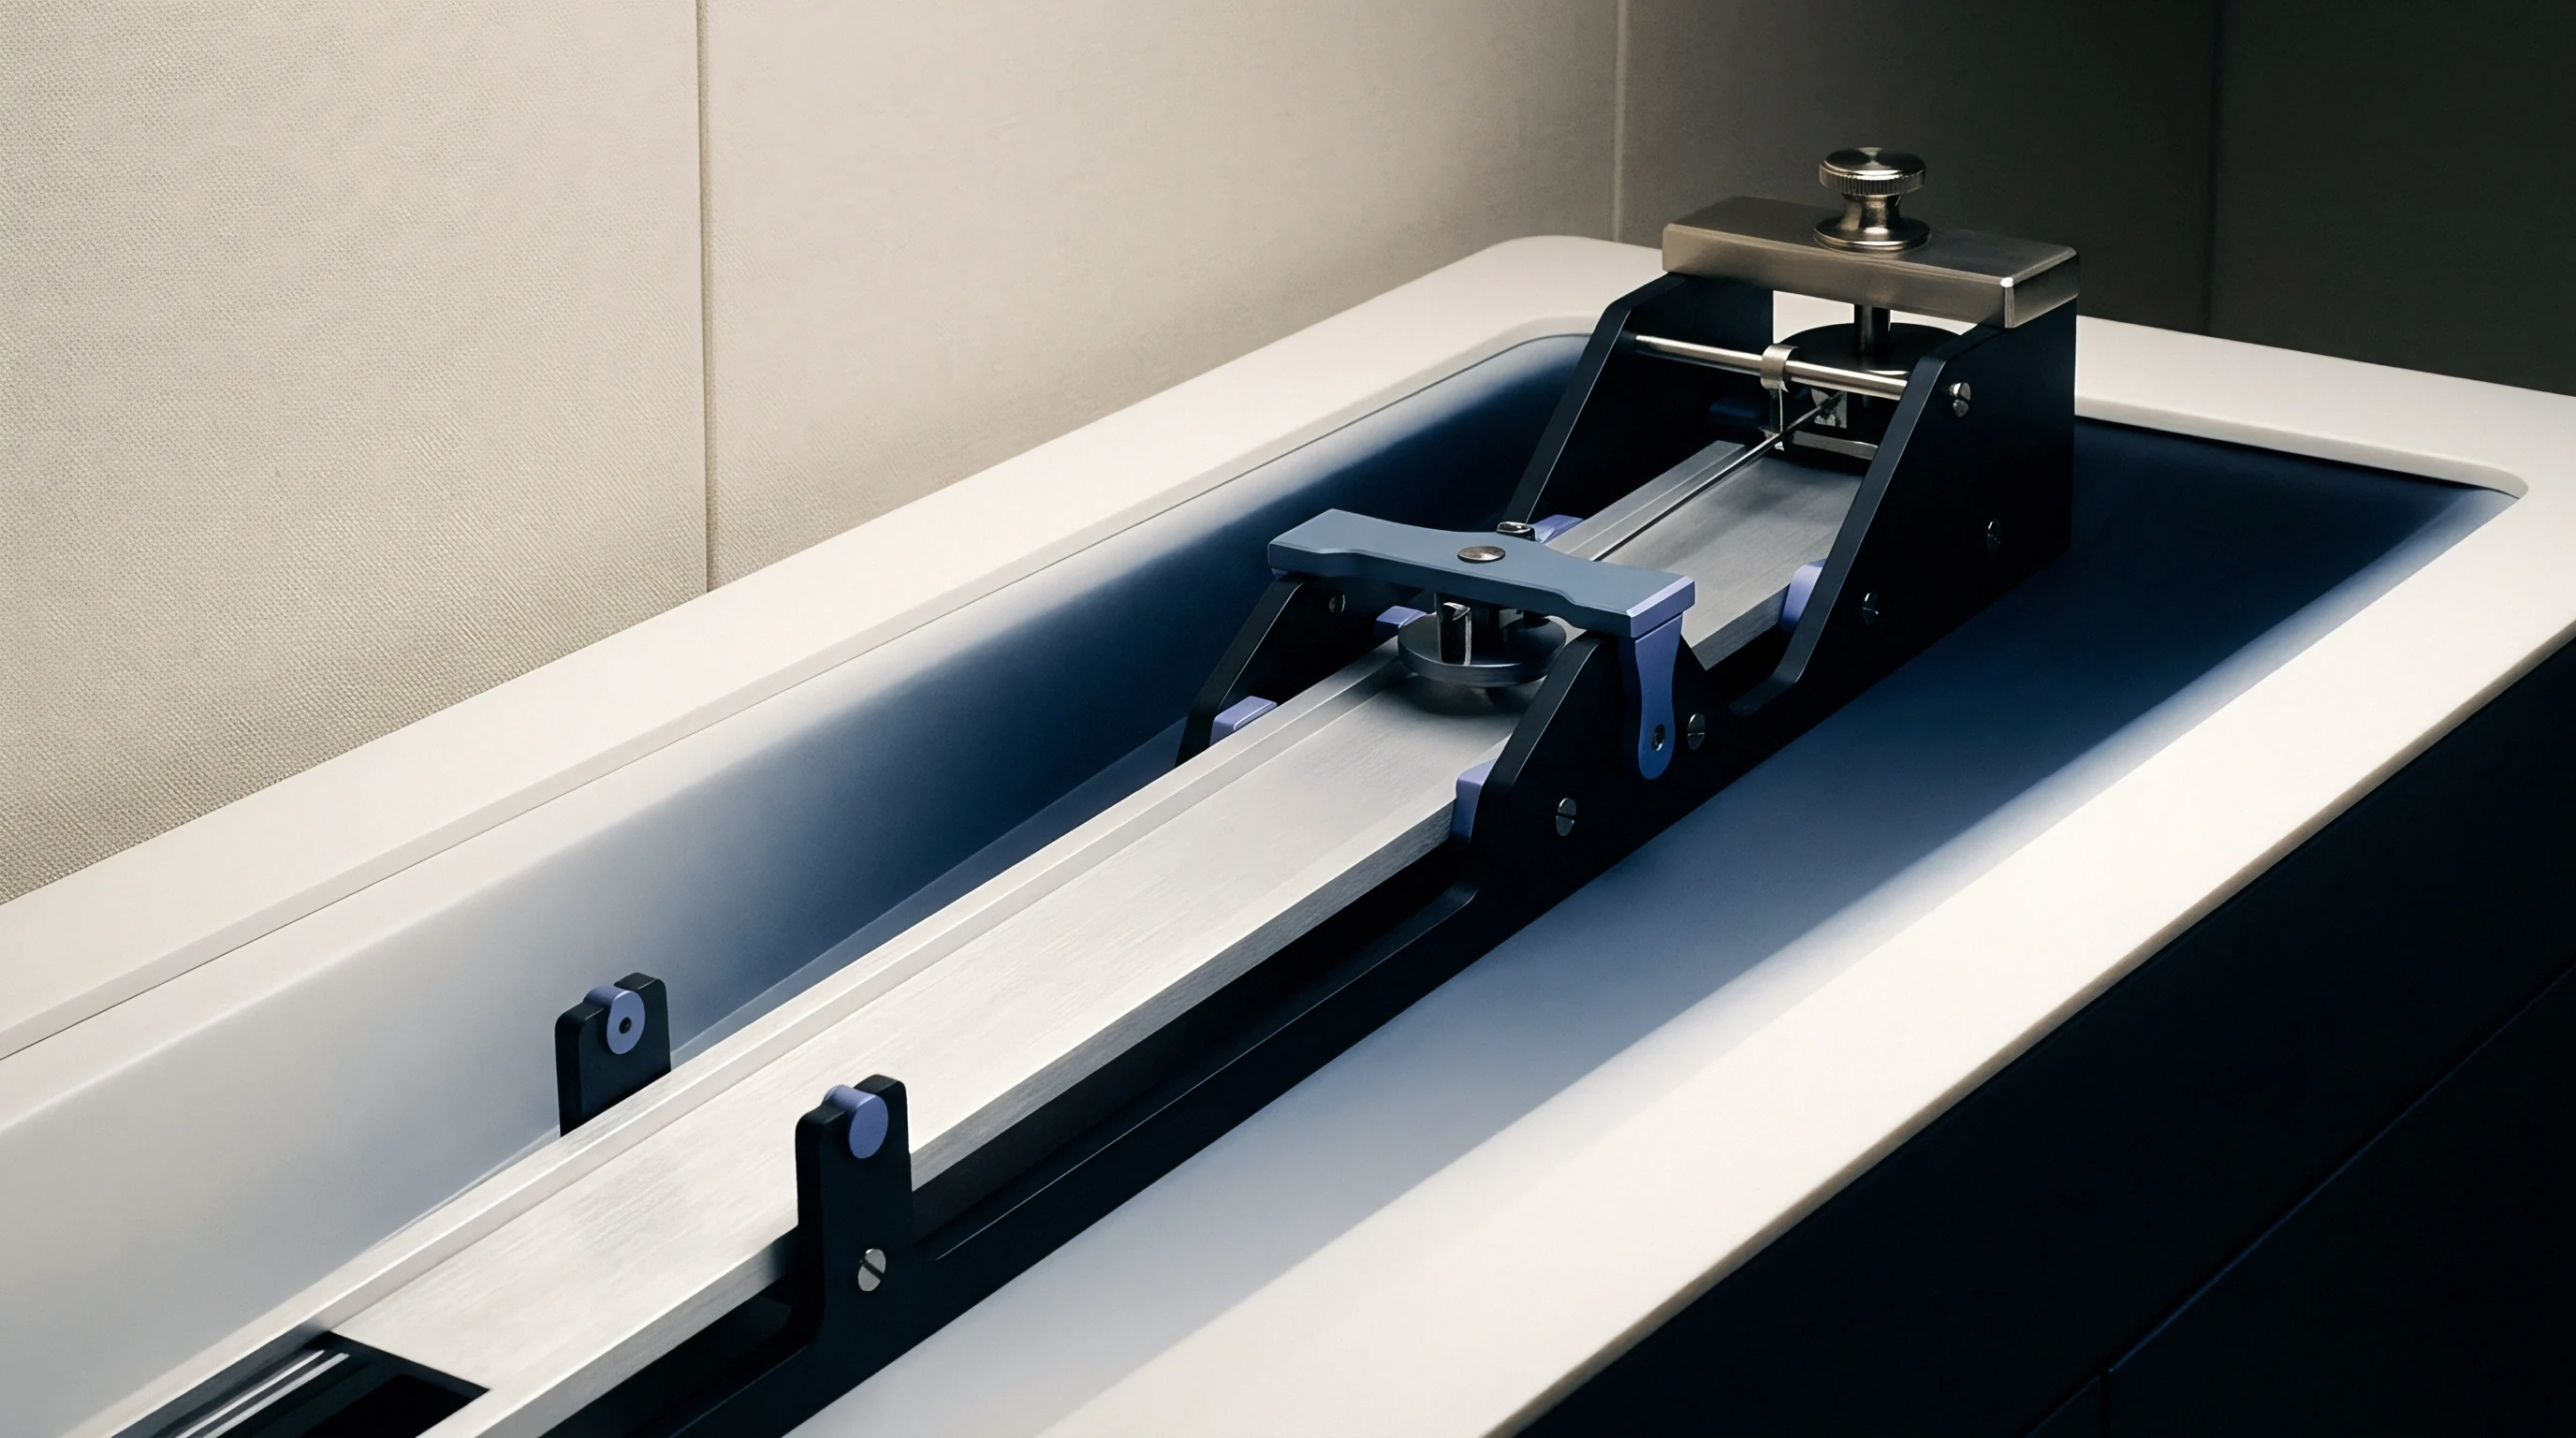
Audit
Procurement files for optical blanks require certified stress-optic constants alongside recorded baseline internal strain levels. Relying on nominal handbook properties introduces substantial error into high-power thermal stress predictions. Substrate manufacturing processes, including raw material synthesis, annealing schedules, and mechanical polishing, introduce lot-to-lot variations in baseline birefringence and mechanical strength.
Technical qualification dossiers verify material compliance prior to optical assembly integration. Quality engineering teams examine certified material test reports to confirm that raw glass blanks pass stringent baseline strain limits. Uncalibrated glass constants distort calculations.
Complete incoming inspection protocol records protect manufacturing operations against early thermal shock fracture and expensive field failures.

Material Quality Dossier and Test Certification
Receiving inspection verify raw substrate specifications using standardized strain measurements prior to polishing and coating operations. Procurement documentation must capture bulk absorption, stress-optic coefficient variance, surface micro-roughness, and residual strain. Substrate materials intended for multi-kilowatt laser applications require comprehensive verification data clear of missing quality parameters.
Material test reports must document baseline optical retardation across ninety-five percent of the clear aperture. Certified optical blanks exhibit residual stress retardation values below two nanometers per centimeter. Documents missing explicit strain test maps indicate unverified annealing quality, increasing thermal failure risk under laser illumination.
Uncalibrated photoelastic constants convert valid fringe order measurements into corrupted principal stress magnitudes.

ISO Standard Polarimetric Test Protocols
Calibration standards define specific light paths and waveplate configurations for quantitative residual birefringence verification. ISO 11455 specifies polarimetric screening protocols for optical glass, establishing standardized classification tiers based on maximum residual retardance. ISO 24013 details test procedures for determining photoelastic constants in transmissive optical materials.
Compliance auditing verifies that testing laboratories execute polarimetric measurements using traceably calibrated light sources and precision optical encoders. Environmental temperature control during testing must remain within plus or minus 0.5 Kelvin to prevent thermal drift artifacts in retardation maps.
Key documentation elements verified during incoming material qualification include:
- Bulk Absorption Certification confirming optical absorption testing via laser calorimetry per ISO 11551 standard methods.
- Residual Birefringence Map demonstrating retardance levels below specification limits across the complete clear aperture per ISO 11455.
- Stress-Optic Constant Validation providing batch-specific measurement values for c1 and c2 constants certified per ISO 24013.
- Edge Surface Micro-Crack Index verifying fine anneal grinding and edge polishing quality to eliminate tensile stress risers.
ISO 24013 Annex B mandates written confirmation of zero load stress-optic coefficients, rendering unverified substrate certificates invalid for high-power laser optics procurement.

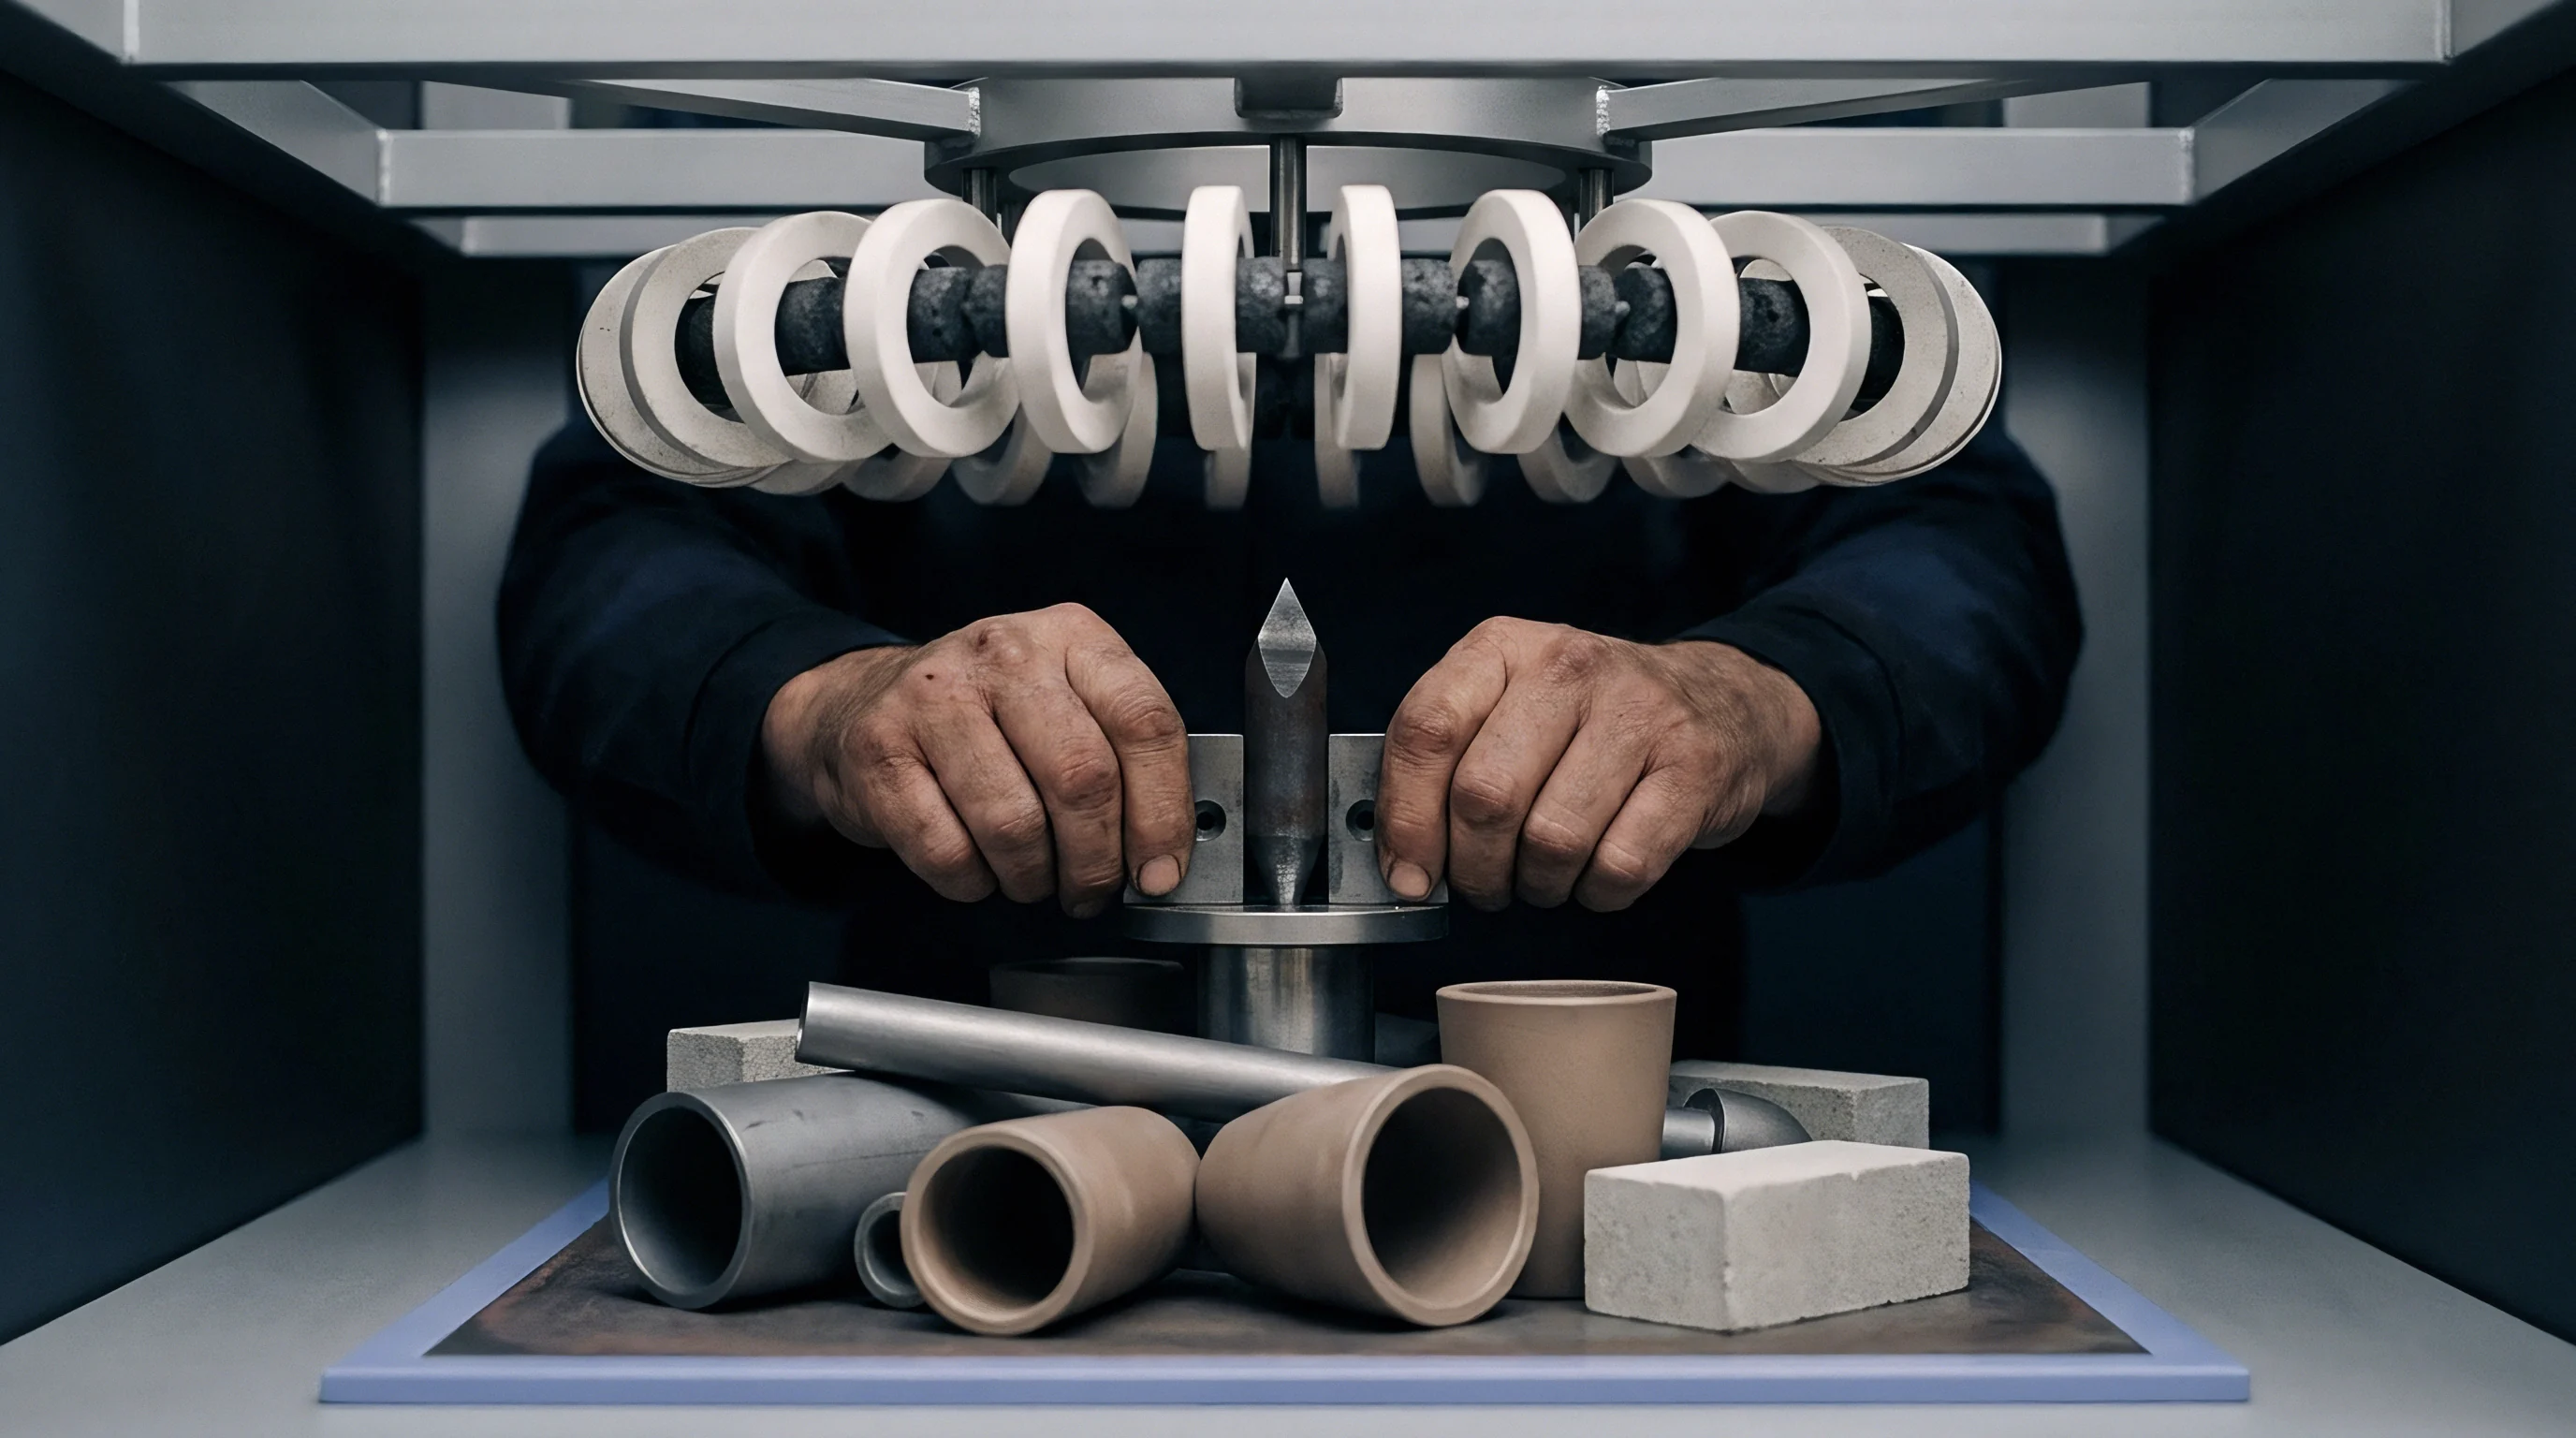
Yield
Structural safety margins govern operational power ceilings before thermal tensile stresses cause catastrophic edge fracture. Operating high-power laser systems near structural limits requires continuous stress monitoring or real-time wavefront feedback. Designing safe power scaling sequences demands exact matching between photoelastic stress limits, thermal dissipation capacity, and mechanical substrate yield strength.
Thermal safety factors range between three and five depending on window edge polish quality and operating environment criticality. Higher safety factors protect against unexpected power surges, beam misalignments, or surface contamination build-up during field operations. Establishing rigid operational stage gates prevents premature power escalation before verifying structural stress limits.
Power Scaling Limits and Safety Factors
Mechanical tensile strength at outer polished boundaries establishes the hard energy capacity ceiling for transmissive optics. While glass materials exhibit exceptional compressive strength exceeding one gigapascal, tensile yield strength remains limited by surface micro-crack depth and edge finish quality. Standard polished glass edges sustain allowable tensile stresses between ten and thirty megapascals before fracture initiation.
Surface defects lower tensile limits. Step testing prevents catastrophic failure. Cold glass edges accumulate tension.
Calculating maximum allowable continuous-wave beam power involves setting outer circumferential tensile stress equal to substrate tensile strength divided by chosen safety factor SF:
sigma_theta_max = sigma_tensile_yield / SF
P_laser_max = (8 pi k sigma_theta_max) / (alpha E A_bulk)
where A_bulk represents bulk material optical absorption per unit length. Pure fused silica resists shock.
Staged Qualification Sequence for High-Power Windows
Stepped illumination trials starting at baseline energy levels validate thermo-elastic modeling assumptions before full operational deployment. Scaling power without intermediate photoelastic validation risks sudden catastrophic glass fracture and internal chamber contamination. The qualification process follows a dated sequence tied to verified stress thresholds.
| Qualification Stage | Thermal Load Level (% Max Power) | Maximum Retardation Limit (nm) | Allowable Rim Tension (MPa) | Mandatory Pass Gate Condition |
|---|---|---|---|---|
| Stage 1: Baseline Audit | 0% (Cold Glass) | < 2.0 nm/cm | 0.0 MPa | Residual strain map certified per ISO 11455 |
| Stage 2: Thermal Ramp | 25% Power Load | < 15.0 nm | < 3.5 MPa | Linear thermal expansion matches thermoelastic model |
| Stage 3: Nominal Load | 75% Power Load | < 45.0 nm | < 10.0 MPa | Wavefront focus shift remains within auto-focus budget |
| Stage 4: Peak Operation | 100% Power Load | < 65.0 nm | < 14.0 MPa | Steady-state fringe profile stabilizes with zero drift |
Selecting window aperture thickness based on radial tensile stress balance preserves beam focus stability and prevents thermal edge failure.