Forensic Subslab Void Analysis and Dynamic Load Transfer Capacity Recalibration Protocols
Subslab voids reduce dynamic load transfer efficiency, escalating slab edge stresses; precision deflection testing and subgrade grouting restore floor capacity.

Cavitation
Subgrade support beneath concrete floor slabs deteriorates through mechanical soil erosion, fine particle migration, and localized pumping under cyclic dynamic loads. As heavy vehicle axles cross unsealed slab joints or active cracks, hydrodynamic pressure surges build inside the saturated subbase. These surges scour fines directly from under the concrete panel, washing particles into adjacent drainage paths or forcing them up through open joint fractures.
Over repeated loading cycles, this ongoing displacement leaves the slab edge cantilevered across an expanding void.
The rate of subslab material loss depends on vehicle speed, axle weight, subgrade permeability, and joint seal integrity. Initial micro-voids measure less than three millimeters deep, escaping notice during static visual inspections. Continued wheel traffic causes transient slab deflections that compress trapped air and water within these pockets, quickening edge scour and drawing the void boundary inward toward the panel center.
High-frequency material handling equipment ~ particularly hard-wheeled forklifts and automated guided vehicles ~ delivers rapid pressure pulses that keep subgrade pore pressures elevated, accelerating lateral erosion.
Subgrade Erosion and Pumping Mechanics
Transient slab deflections generate fluid shear forces that mobilize subgrade fines. Approaching a transverse joint, an axle deflects the leading panel downward, driving water and suspended soil across the joint fracture toward the trailing panel. Once the wheels cross over, the leading slab rebounds while the trailing slab suddenly drops.
That downward snap drives the trapped fluid back toward the leading panel under substantial pressure, generating an abrasive slurry that scours the base.
Pumping dynamics depend largely on soil gradation and moisture levels in the subgrade. Cohesionless sands and silty gravels erode readily once pore water reaches saturation. Over low-permeability clay subgrades, slabs develop interface slurries and softened surfaces that yield broad, shallow voids.
Similarly, dense-graded aggregate bases lacking adequate drainage retain free water at the slab interface, breaking down under substantially fewer dynamic axle passes than free-draining, open-graded layers.
Soil base degradation accelerates exponentially once interface moisture levels reach full saturation under dynamic axle passings.

Dynamic Vehicle Axle Impact Patterns
Heavy wheel loads at normal plant operating speeds induce significant dynamic amplification across the floor system. While static structural design addresses dead loads and uniform live loads, transient wheel impacts generate localized shear stress peaks forty to eighty percent higher than static calculations assume. Hard polyurethane or steel wheels concentrate forces across minimal contact areas, driving local stresses past eight megapascals.
The resulting panel edge deflection repeatedly drives the underside of the concrete against the base layer.
Vehicle acceleration, braking, and steering introduce inclined dynamic loads that change stress paths into the subbase. Acceleration shifts axle weight rearward, increasing trailing edge deflections during transit. Cornering introduces lateral thrust across slab joints, tearing joint sealants and admitting surface liquids into subslab voids.
Over time, cyclical loading degrades aggregate interlock along un-doweled joints, diminishing shear transfer and worsening the edge deflections responsible for base erosion.
| Axle Configuration | Static Load (kN) | Dynamic Load Factor | Repetitions to Void Initiation | Subgrade Modulus Reduction (%) |
|---|---|---|---|---|
| Single Hard-Wheel MHE | 45 | 1.65 | 120,000 | 38 |
| Dual Pneumatic AGV | 80 | 1.35 | 250,000 | 27 |
| Tandem Heavy Transport | 120 | 1.50 | 85,000 | 52 |
| Triple Axle Yard Hostler | 180 | 1.70 | 42,000 | 65 |
Void Geometry Categorization and Boundary Mapping
Subslab voids typically form three geometric patterns: linear edge channels, broad interior dishes, and corner intersection pockets. Edge channels follow joints and working cracks where fluid pumping actively scours material. Interior dishes develop near panel midspans when moisture-gradient curling lifts the slab center in dry ambient air.
Corner pockets form at four-panel intersections, where structural rigidity reaches its minimum and dynamic uplift peaks under eccentric axle loads.
Delineating cavity boundaries requires sufficient spatial resolution to distinguish curling geometry from genuine subgrade loss. Linear voids along joints typically span fifteen to forty centimeters across and track the joint line for several meters. Interior voids form irregular, dish-like profiles up to two meters across, usually five to fifteen millimeters deep.
Mapping these boundaries governs injection port spacing during remediation and dictates the derating needed to run equipment safely across damaged panels.
Selecting repair strategies without mapping full cavity boundaries routinely causes secondary floor failures under operational traffic. Grouting solely along joints leaves interior spans unsupported, transferring dynamic impact loads onto unbacked concrete. Cantilevered slab sections eventually exceed their ultimate tensile strain limits, producing full-depth cracking and severe joint spalling in busy logistics aisles.

Sounding
Non-destructive evaluation identifies subsurface voids and moisture pockets well before surface cracks appear. Ground-penetrating radar units with high-frequency, ground-coupled antennae transmit electromagnetic pulses into the slab, recording reflections wherever dielectric properties change. Slabs generally exhibit dielectric constants between six and nine, whereas air voids register at one and water-saturated zones approach eighty.
These contrasts produce distinct, high-amplitude reflections that delineate subsurface anomalies.
Acoustic impact techniques complement radar by assessing mechanical response across the concrete. In impulse response testing, an instrumented hammer strikes the surface to generate stress waves while an adjacent geophone captures the vibrational response. Signal processing converts time-domain force and velocity records into dynamic mobility spectra, allowing engineers to calculate slab stiffness and map loss of support.
Elevated mobility coupled with reduced dynamic stiffness points to subgrade voids or advanced delamination.

Ground Penetrating Radar Calibration and Dielectric Variance
Accurate radar interpretation hinges on calibrating wave velocities to the specific slab. Variations in age, moisture, aggregate geology, and reinforcement density alter signal propagation speeds, introducing depth errors if unadjusted. Field calibration establishes baseline dielectric values by scanning over known panel thicknesses or metallic reflector plates set inside micro-cores.
Antennae in the 1.5 to 2.6 gigahertz range provide the vertical resolution required to identify voids down to three millimeters beneath slabs up to forty centimeters thick.
Scans follow orthogonal grid lines along primary joint layouts, with survey wheels tracking passes spaced no wider than thirty centimeters across investigation areas. Processing filters apply background removal, gain adjustments, and time-zero corrections to separate true subgrade reflection profiles from surface reinforcement clutter. The resulting horizontal amplitude slices map void perimeters, slab thickness variations, and moisture accumulation across the floor.
- Dielectric Discontinuity Anomalies Pronounced reflection pulses develop along boundaries between concrete and air or water, creating sharp phase inversions that mark void margins.
- Reinforcement Mesh Signal Attenuation Dense welded wire fabric and closely spaced dowels scatter electromagnetic energy, masking deeper reflections and requiring adjusted antenna polarization during data collection.
- Moisture Saturation Edge Masking Elevated moisture along unsealed joints reduces wave velocity, generating signal ringing that obscures shallow voids unless background subtraction filtering isolates the base interface.
- Acoustic Impedance Mismatch Blindness Unbonded polymer vapor barriers generate reflections similar to dry air voids, requiring phase-polarity analysis to differentiate membrane interfaces from true subgrade loss.

Impulse Response Mobility Spectrum Analysis
Mobility calculations derived from hammer impacts characterize structural support conditions across the slab. Sound, well-supported concrete yields average mobility values between two and six meters per second per newton times ten to the minus seven. When subgrade erosion undermines support, mobility values rise to fifteen or thirty, signaling reduced flexural stiffness.
Contour plots of these values delineate zones that require pressure grouting.
Low-frequency spectral response analysis provides dynamic stiffness values that verify mobility findings. A continuously supported slab exhibits a linear force-velocity slope between one hundred and eight hundred hertz. Subslab voids introduce non-linear dynamic behavior, reducing dynamic stiffness from typical baselines of two hundred kilonewtons per millimeter to values below fifty.
These reductions track directly with degraded subgrade reaction moduli under vehicle traffic.
ASTM D6432 standard practices mandate antenna frequency selection matched to concrete thickness and targets to prevent high-frequency signal extinction in moist subgrades.
Core Verification and Petrographic Borehole Profiling
Coring provides physical ground truth to calibrate radar and acoustic data. Core drills extract fifty- or one-hundred-millimeter diameter concrete cylinders directly over identified anomalies. Lowering an optical endoscope into the borehole confirms cavity depth, subgrade condition, and the presence of interface water.
Subsequent petrographic analysis evaluates consolidation, micro-cracking, and base carbonation depth.
Boreholes reveal the vertical stratigraphy of the floor system, documenting panel thickness variations from subgrade settlement or placement tolerances. Down-hole imaging determines whether subgrade loss originates from mechanical pumping, aggregate sulfate degradation, or differential drying shrinkage that curls the slab edges. These core observations establish reliable depths for calibrating geophysical surveys and calculating injection grout volumes.
High-frequency radar cannot map all subslab voids reliably without core calibration and moisture corrections, despite assumptions of automated detection. Saturated subbase aggregates alter electromagnetic travel velocities by up to forty percent, causing uncalibrated surveys to misinterpret damp compacted gravel as void space. Foregoing physical core verification often directs grouting into sound, damp subgrades while leaving dry structural cavities under high-traffic aisles untreated.

Deflection
Load transfer efficiency across slab joints governs industrial floor longevity under dynamic vehicle traffic. As axles pass over joints, doweled slab edges deflect vertically, distributing shear loads through dowel bars, aggregate interlock, and the subbase. When subgrade erosion removes joint-edge support, vertical deflections increase sharply under axle passes.
This excess movement spikes shear stresses in dowel bars and accelerates interlock degradation, dismantling the joint’s load-sharing capacity.
Assessing joint performance relies on falling weight deflectometer testing. The system drops calibrated weights onto a segmented plate adjacent to the joint, generating impulse loads from thirty to one hundred twenty kilonewtons. Seismic geophones placed on both sides of the joint line simultaneously record deflection basins on the loaded and unloaded panels.
Analyzing these response basins quantifies load transfer efficiency and isolates mechanical dowel looseness from subgrade softening.

What Triggers Load Transfer Recalibration in Rigid Pavements?
Floor load ratings require recalibration when dynamic load transfer efficiency falls below acceptable operational thresholds. Load transfer efficiency is calculated directly as the ratio of unloaded-edge to loaded-edge deflection. At one hundred percent efficiency, adjacent panel edges share wheel loads equally, minimizing edge flexural stresses.
When erosion strips away subgrade support along the joint, aggregate interlock fails and dowel sockets loosen, reducing load transfer efficiency toward zero.
Mechanical dowel looseness develops when repetitive dynamic shear forces crush concrete around the dowel bars, enlarging the cylindrical embedment sockets. This free play permits the loaded slab to drop several millimeters before engaging the dowel steel, delaying shear distribution. Across that uncoupled movement, the loaded edge carries one hundred percent of the dynamic wheel force while bridging the void below.
High flexural tensile stresses then develop along the top surface parallel to the joint, prompting top-down corner breaks and longitudinal cracks.
Load transfer calculations require temperature normalization. High ambient temperatures cause concrete panels to expand, tightening joint faces and inflating aggregate interlock measurements during afternoon testing. In contrast, colder conditions open joint gaps, revealing mechanical looseness and unmasked subgrade loss.
Deflection records taken across differing thermal conditions must therefore be normalized to a reference baseline of twenty degrees Celsius.

Falling Weight Deflectometer Strain Diagnostics
Deflection basin analysis utilizes geophones positioned at set radial distances from the load center to capture slab curvature under impulse loading. Sensors placed at zero, three hundred, four hundred fifty, six hundred, and nine hundred millimeters trace the basin geometry. A steep, narrow basin indicates localized subgrade softening or voiding directly below the plate, whereas a broad, shallow basin reflects competent base support with a high reaction modulus.
The impulse forces delivered during deflectometer testing mirror heavy material handling equipment at operating speeds. Pulse durations of twenty-five to thirty milliseconds replicate wheel contact intervals measured under industrial traffic. By capturing peak deflections under a sixty-kilonewton pulse, the test identifies sub-millimeter panel movement, detecting subgrade deterioration long before joint spalling or faulting appears at the surface.
Subslab void formation dropping dynamic load transfer efficiency below sixty percent increases maximum slab edge flexural stress by seventy-five percent under standard fifty-kilonewton axle loadings.

Joint Efficiency Recalibration Mathematical Framework
Recalibrating floor load limits requires recalculating allowable wheel weights from measured joint transfer efficiencies and back-calculated subgrade moduli. Maximum edge flexural stress is evaluated using modified Westergaard formulations that integrate dynamic load transfer coefficients, bounding allowable stress by the concrete modulus of rupture divided by a design safety factor appropriate for expected traffic volume.
Take an industrial floor slab thirty centimeters thick subjected to dual-wheel axle loads. Design specifications assumed a subgrade modulus of fifty-five megapascals per meter and a joint load transfer efficiency of eighty-five percent. Deflectometer testing reveals that subgrade erosion has lowered the reaction modulus to twenty megapascals per meter, while dowel wear has dragged joint efficiency down to forty-five percent.
Evaluating the joint load transfer coefficient indicates how much of the dynamic load remains on the loaded edge as efficiency drops:
γL = frac11 + left(fracLTE100right) = frac11 + 0.45 = 0.690
The loaded slab edge must now support 69.0 percent of the total dynamic axle load, compared to 54.1 percent under the original eighty-five percent design condition.
Recalculating the radius of relative stiffness using the degraded subgrade parameters:
ell = sqrt fracE · h312 · (1 – ν2) · k
Using a concrete modulus of elasticity E = 30,000 MPa, slab thickness h = 0.30 m, Poisson ratio ν = 0.18, and reduced subgrade modulus k = 20 MPa/m:
ell = sqrt frac30000 · 0.30312 · (1 – 0.182) · 20 = sqrt frac810232.22 = 1.368 meters
Under intact subgrade conditions (k = 55 MPa/m), the original radius of relative stiffness was 1.063 meters. The expanded radius confirms that slab curvature flattens across a wider area, concentrating higher bending stresses directly below the wheel footprint.
Computing maximum edge flexural stress under a sixty kilonewton dynamic axle load (P = 30 kN per wheel set):
σe = frac3 · (1 + ν) · P · γLπ · (3 + ν) · h2 · left
Applying the degraded parameters yields a maximum edge tensile stress of 3.82 megapascals. With concrete flexural strength at 4.50 megapascals and a target safety factor of 1.50, the allowable working stress limit stands at 3.00 megapascals. Because working dynamic stress (3.82 MPa) exceeds the 3.00 MPa allowable threshold, the operational axle load rating must be derated by twenty-one point five percent until subgrade support is restored.
| Geophone Deflection Range (μ m) | Load Transfer Efficiency (%) | Dowel Looseness Index (mm) | Structural Action State | Operational Load Rating (%) |
|---|---|---|---|---|
| < 150 | 80 – 100 | < 0.05 | Full Rigid Transfer | 100 |
| 150 – 350 | 65 – 79 | 0.05 – 0.20 | Moderate Dowel Wear | 85 |
| 350 – 600 | 45 – 64 | 0.20 – 0.50 | Severe Voiding / Edge Shear | 65 |
| > 600 | < 45 | > 0.50 | Full Cantilever Action | 40 |
Seasonal moisture fluctuations in the subgrade accelerate micro-fretting along the dowel-concrete interface as dynamic wheel passes continue to load the unseated joint.

Kinematics
Transient pulse forces from moving vehicles propagate through floor assemblies as stress waves, inducing non-linear dynamic motion across panels and subbase strata. Axle passes generate vertical shear waves and horizontal Rayleigh waves that compress and displace supporting subgrade soils. When vehicle operating speeds match panel resonant frequencies, dynamic deflections amplify, sharply accelerating structural fatigue over ungrouted voids.
Kinematic analysis tracks slab displacement, acceleration, and dynamic strain throughout wheel transit. Unsupported panel edges drop rapidly under wheel impact, decelerating abruptly when the underside strikes high points in the eroded subbase. This cyclical hammering crushes aggregate base material into fine powder, which pumps through open joints whenever moisture enters the system.
Transient Wheel Load Pulse Propagation
Load pulse duration is a function of vehicle velocity and tire contact length. Transport equipment running at six meters per second generates transient load pulses under twenty milliseconds. Such brief impulses create sharp stress gradients through the panel depth, concentrating shear stresses near the top surface while subgrade layers experience attenuated, phase-delayed compression.
Slower heavy haulers apply longer load pulses that permit full vertical strain basins to develop across the subgrade. Extended pulse durations squeeze pore water from saturated silts, accelerating consolidation settlement beneath busy logistics lanes. Evaluating pulse profiles enables engineers to set appropriate dynamic testing frequencies and determine fatigue limits under specific warehouse operating speeds.

Cyclic Fatigue and Edge Flexural Stress Excursions
Fatigue damage in concrete accumulates non-linearly according to the cyclical flexural stress ratio ~ the maximum dynamic tensile stress divided by the modulus of rupture. When subgrade erosion drives this stress ratio from 0.4 up to 0.7, the slab’s operational fatigue life plunges from millions of load repetitions to just several thousand passes before structural failure.
Edge stress excursions arise whenever wheel paths track within thirty centimeters of unsupported corners or un-doweled joint seams. Cantilever bending over subslab voids induces tensile strain at the top surface, initiating downward micro-cracks that advance toward the base. As cracking penetrates past mid-depth, panel stiffness deteriorates rapidly, often ending in sudden fracture under routine traffic.
- Measure static baseline deflections across joint networks during maximum thermal contraction.
- Apply transient dynamic impulse loads using calibrated drop-weight systems while recording loaded and unloaded corner responses.
- Calculate dynamic load transfer efficiencies while filtering out ambient thermal curling effects.
- Compare measured differential deflections against structural shear limits for the existing dowel configuration.
- Establish revised operational axle ratings for material handling equipment across affected floor zones.
Concrete panel fatigue failure occurs exponentially faster when subgrade support loss elevates transient flexural stress ratios above zero point five five.
ACI 360R-10 guidance establishes that slab designs predicated on uniform subgrade support lose their structural ratings when localized voiding exceeds ten percent of panel area. Typical industrial lease and maintenance agreements require floor derating or pressure injection grouting whenever dynamic edge deflections exceed 0.75 millimeters.


Injection
Restoring subgrade contact beneath compromised floor slabs requires pressure injection using either hydro-insensitive polyurethane polymers or microfine cementitious slurries. Injection materials must flow into narrow air cavities, displace standing water, and cure rapidly to achieve designated compressive and stiffness targets. High-density, closed-cell polyurethanes expand via an exothermic reaction, producing controlled expansion pressures that re-establish support along the slab underside.
Microfine cement grouts incorporate milled blast furnace slag or Portland cement ground to particle sizes below ten micrometers. This fine particle distribution allows slurries to permeate micro-voids and granular base pores that obstruct conventional neat cement. Fluid rheology and controlled hydration permit comprehensive void filling across broad interior areas without generating excess hydration heat or escaping into perimeter drains.
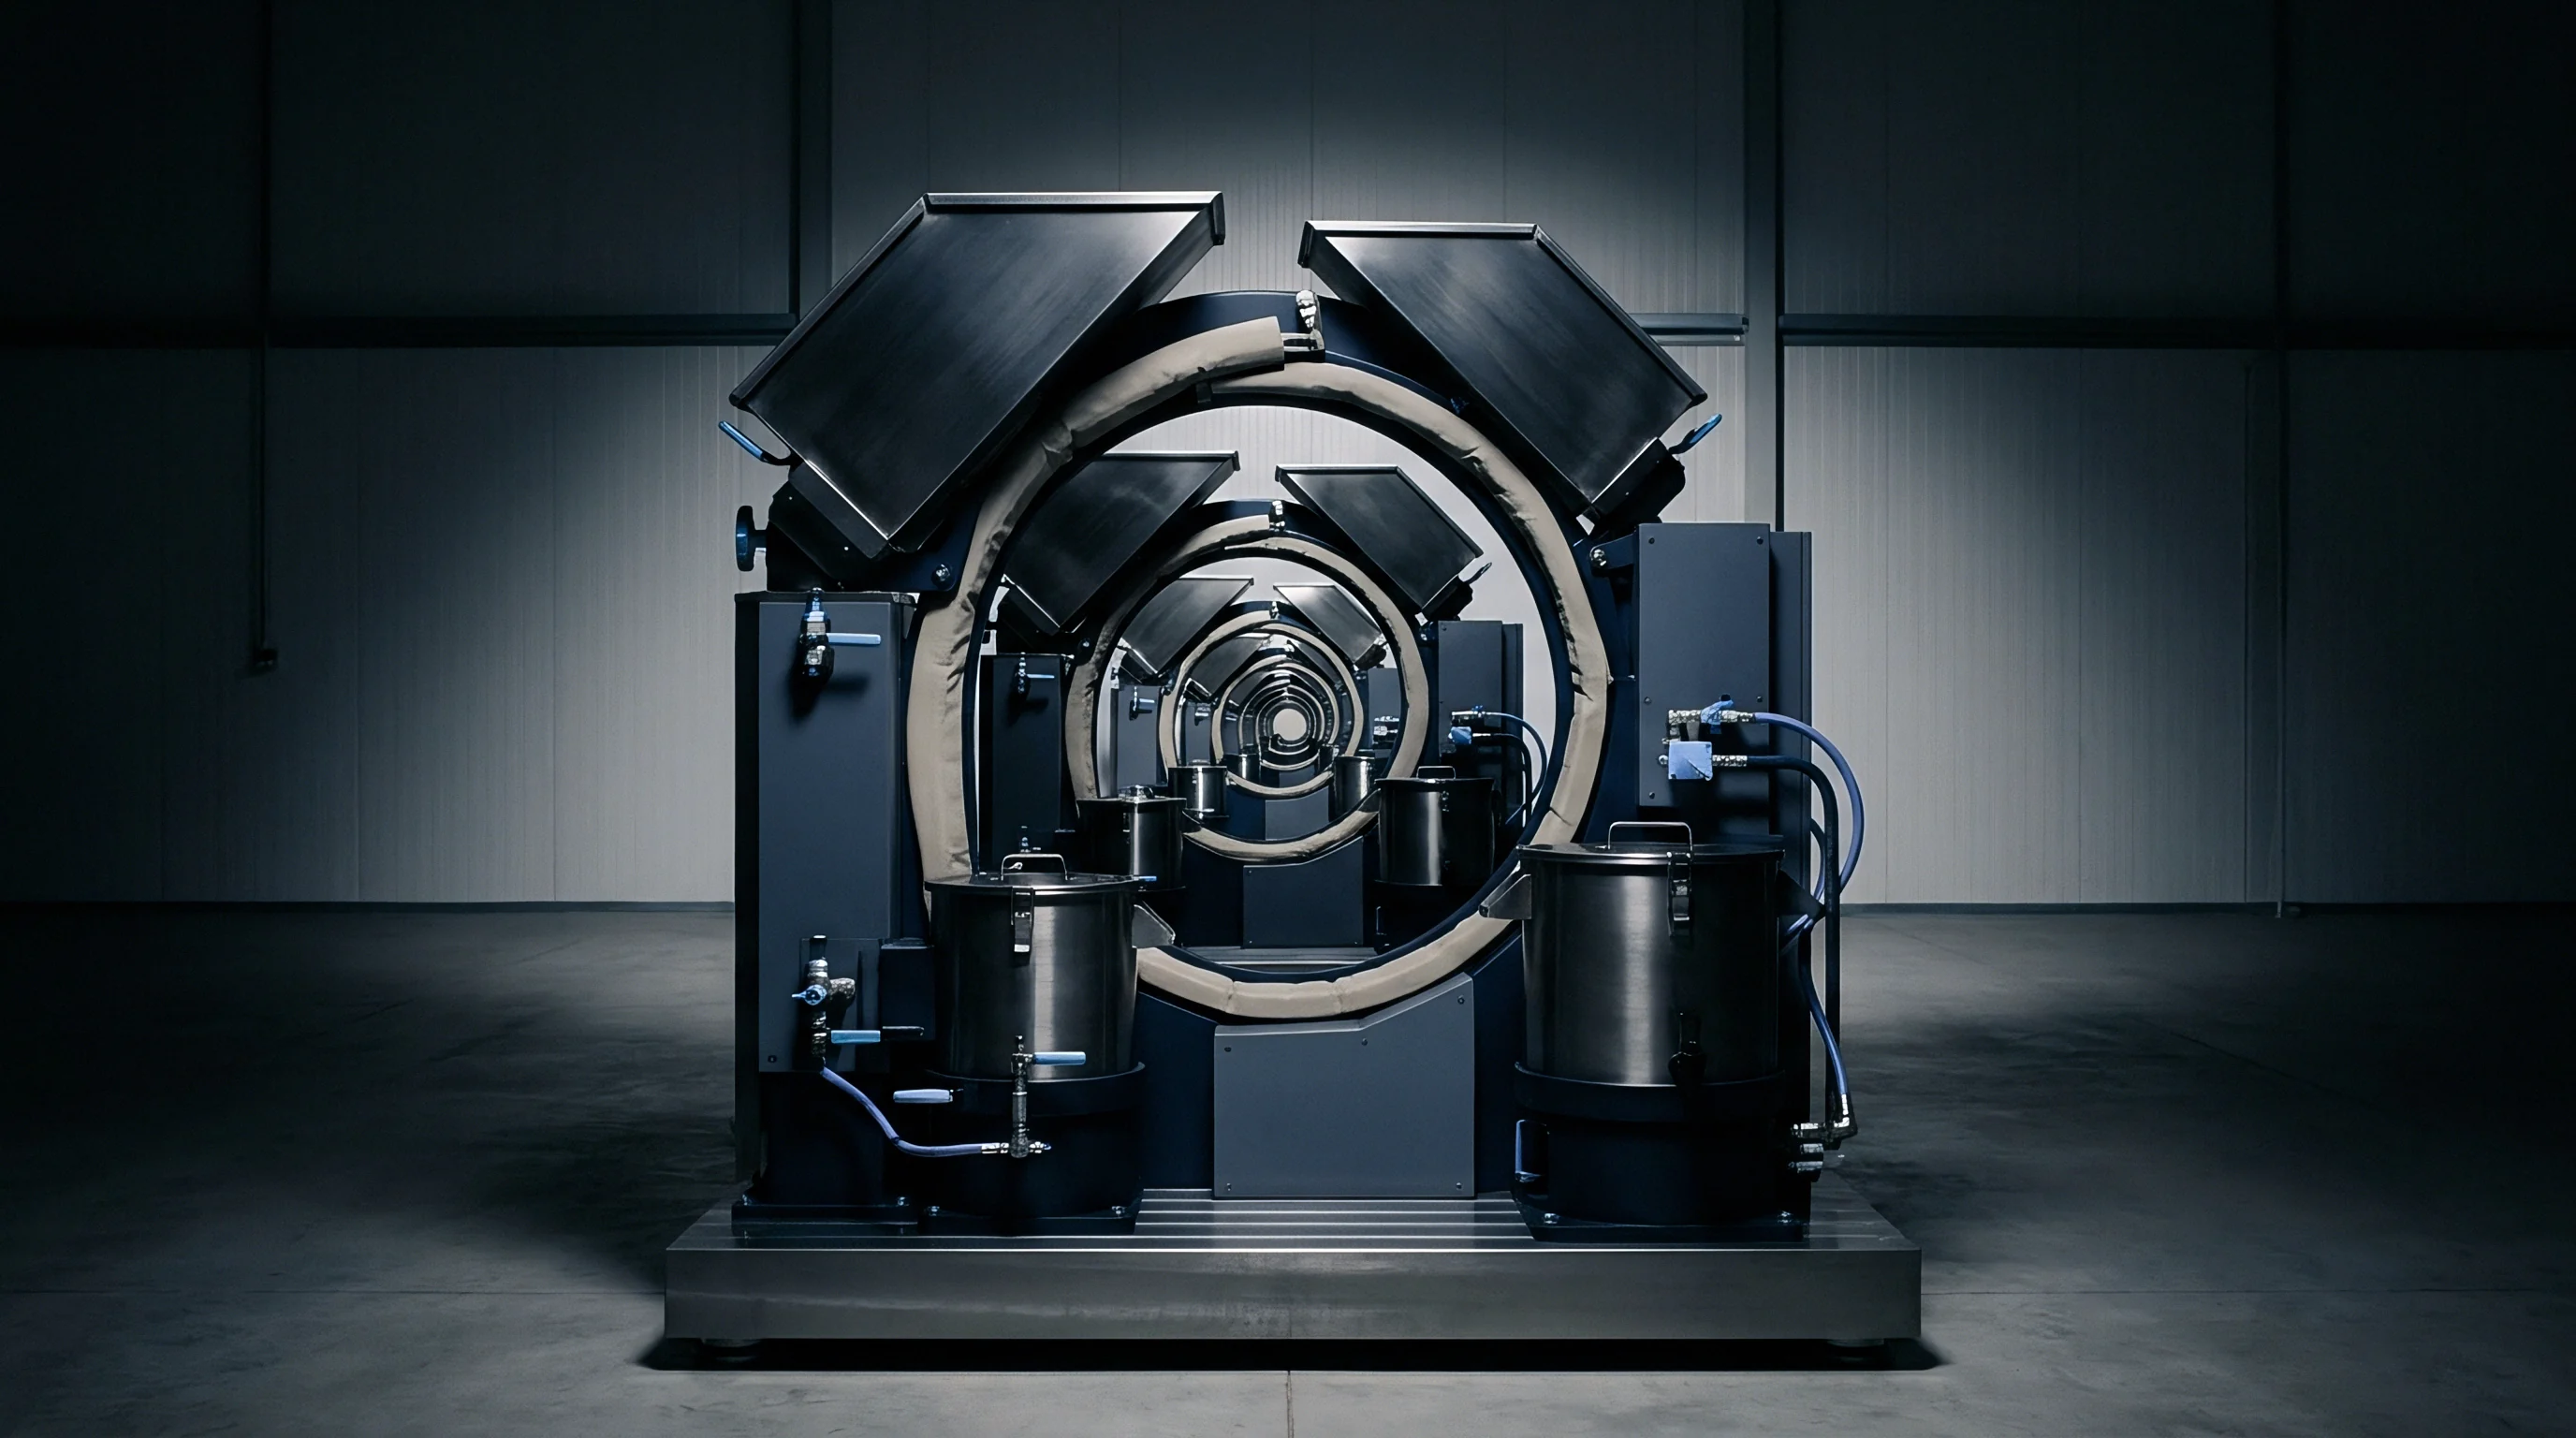
Polyurethane and Cementitious Rheology Comparison
Polyurethane systems feature low initial viscosities and fast reaction profiles, penetrating thin gaps before expanding up to thirty times their liquid volume. Hydro-insensitive blends cure predictably in the presence of standing water, retaining closed-cell integrity without absorbing moisture or breaking down under dynamic pumping. At expanded densities between sixty and one hundred twenty kilograms per cubic meter, they provide compressive strengths from 1.5 to 4.5 megapascals.
Microfine cement grouts yield higher final compressive strengths and dynamic moduli, making them preferable under severe wheel loadings. Twenty-eight-day compressive strengths exceeding thirty megapascals resist repeated heavy track and wheel stresses over decades. Formulations incorporate superplasticizers to maintain fluidity under low pumping pressures, preventing unintentional slab heave during delivery.
| Material Parameter | High-Density Polyurethane | Microfine Cementitious Grout | Standard Portland Neat Grout |
|---|---|---|---|
| Viscosity at Injection (cP) | 50 – 150 | 200 – 400 | 1200 – 2000 |
| Expansion Volume Ratio | 4:1 to 30:1 | 1:1 (Non-expansive) | 1:1 (Non-expansive) |
| Initial Set Time | 45 – 90 seconds | 120 – 240 minutes | 300 – 480 minutes |
| Compressive Strength (MPa) | 2.5 – 6.0 | 25.0 – 40.0 | 12.0 – 18.0 |
| Flexural Modulus (MPa) | 80 – 180 | 1200 – 2500 | 600 – 900 |
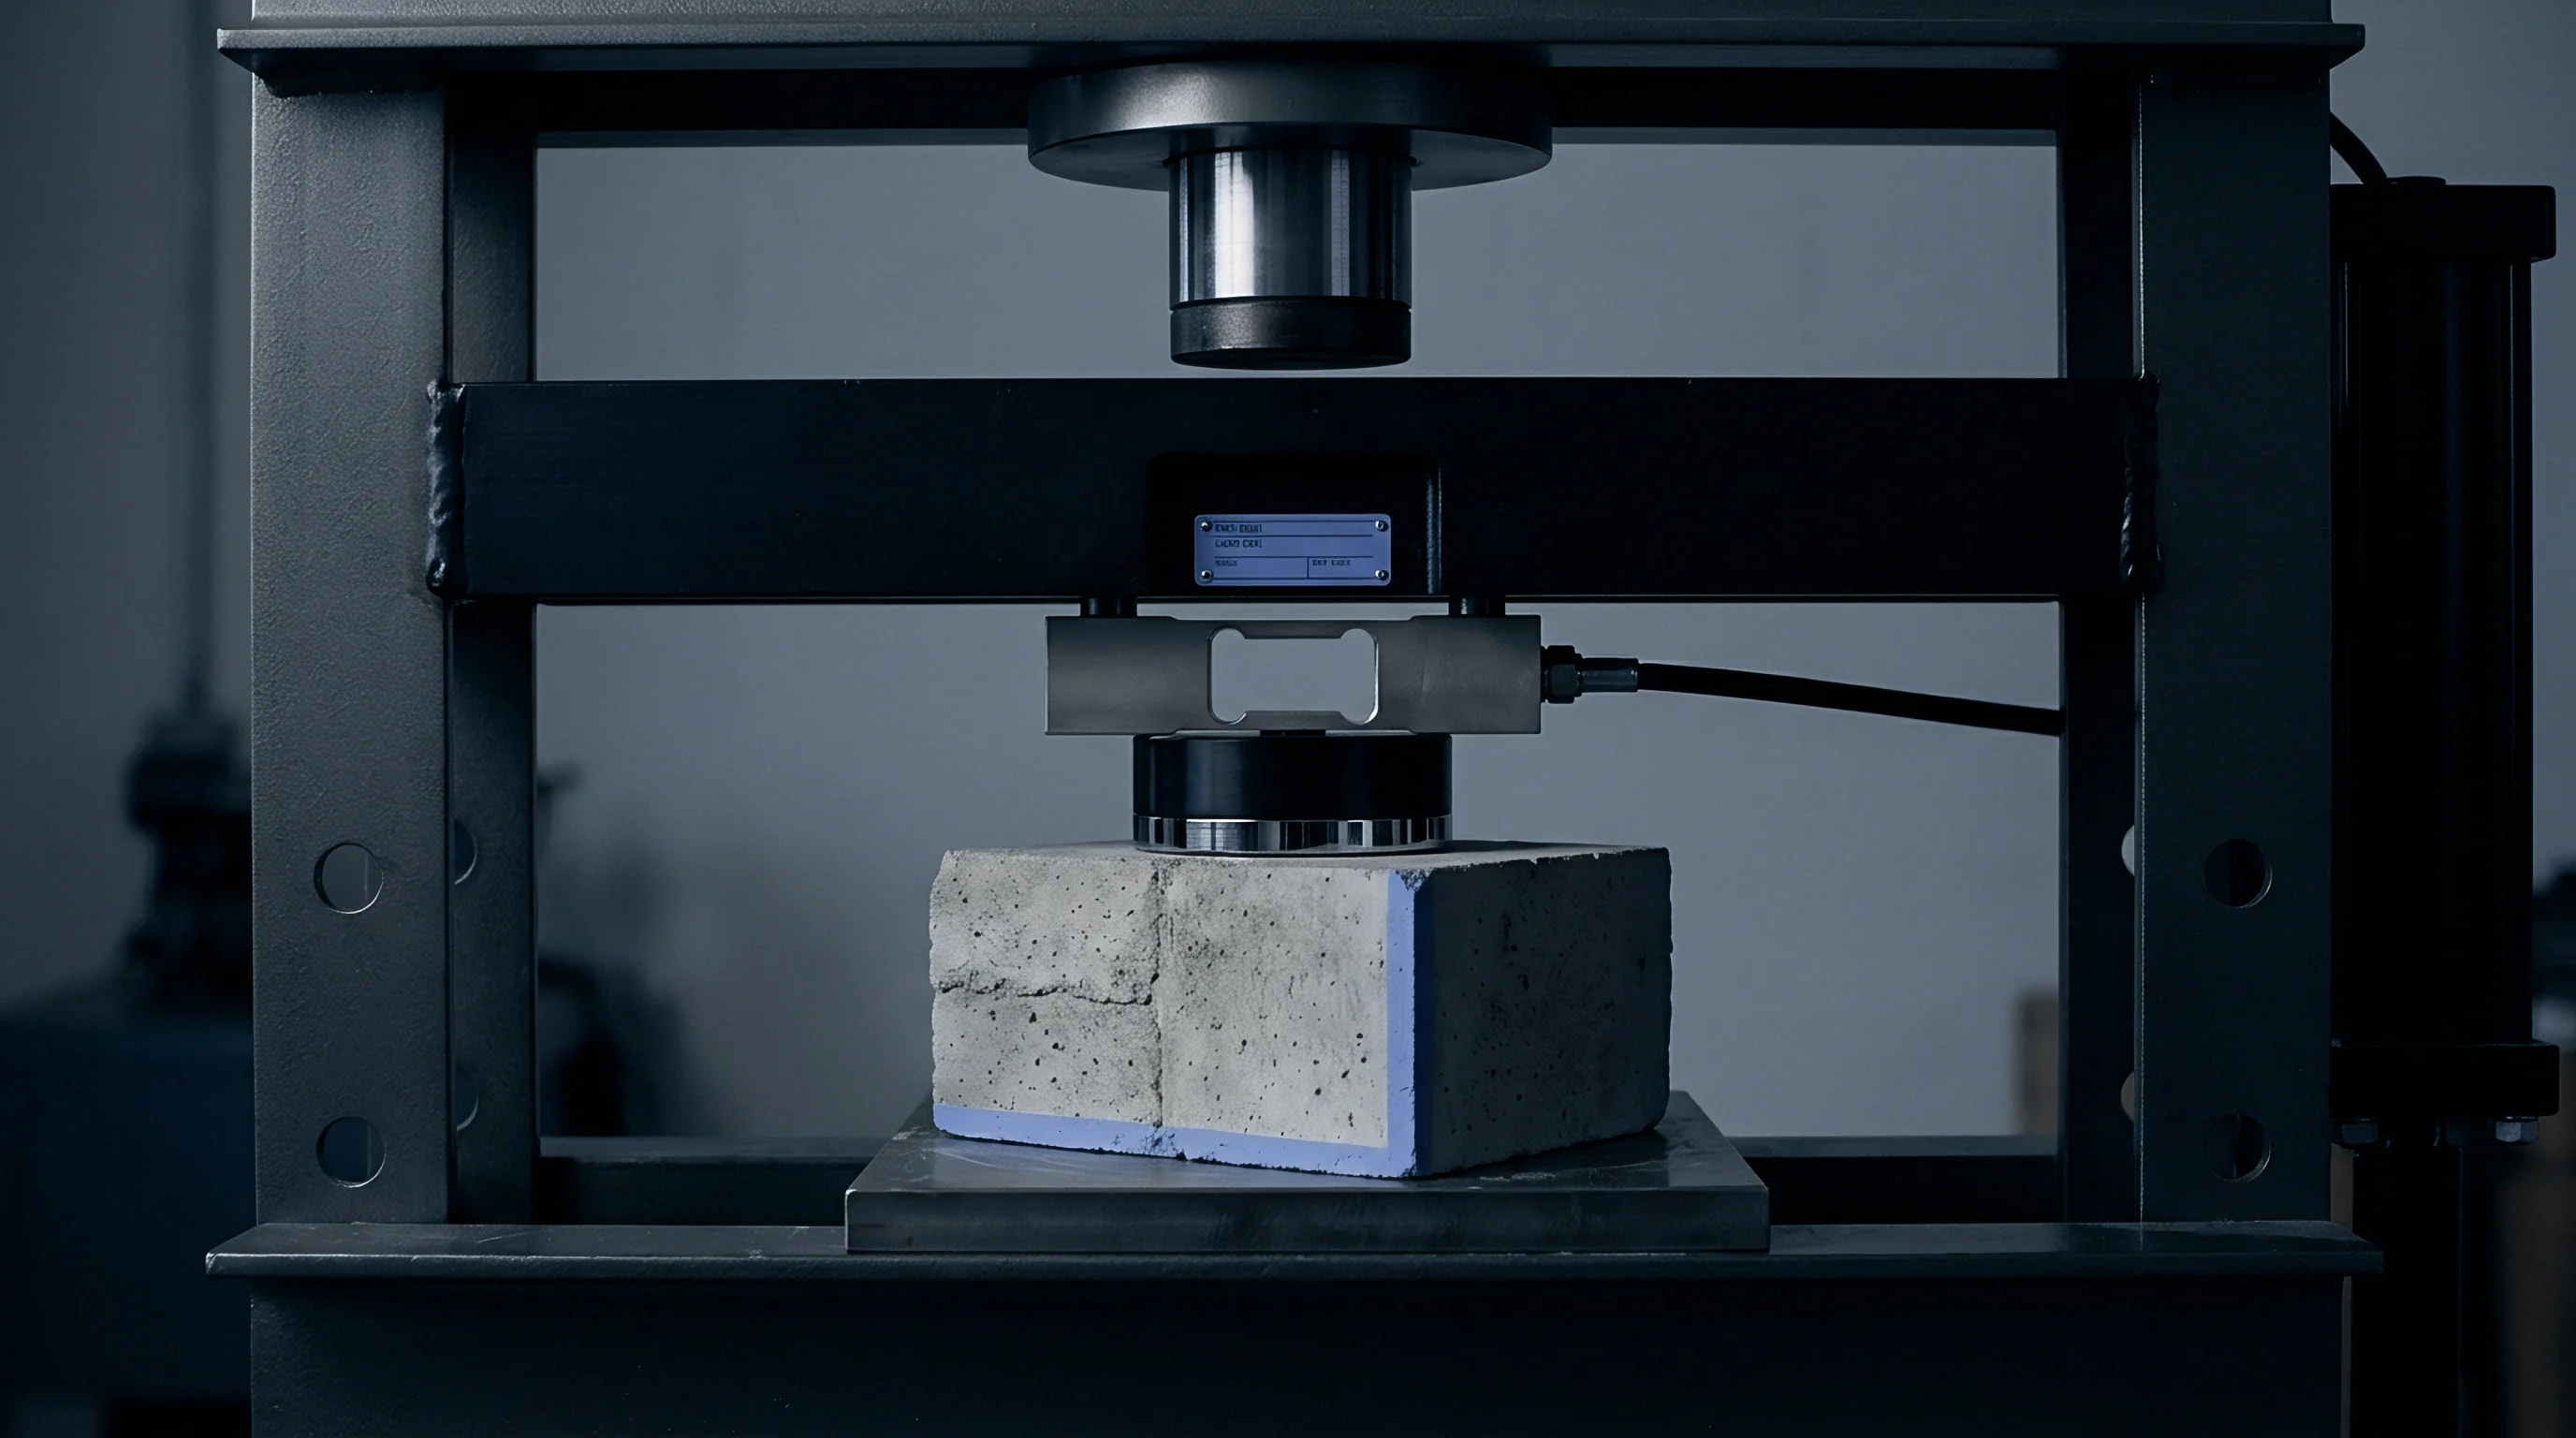
Precision Void Filling and Floor Elevation Monitoring
Grout placement requires continuous laser tracking to prevent over-lifting the slab during pumping. Laser targets set across panel corners track vertical displacement with sub-millimeter precision. Operators drill injection ports on a one-meter grid and insert delivery wands linked to low-pressure proportioners.
Pumping halts the instant sensors register 0.25 millimeters of vertical movement, verifying that the subslab cavity has closed.
In-line transducers monitor delivery and expansion pressures beneath the concrete. Injection pressures stay below two hundred kilopascals to prevent localized shear fracturing around drill ports. Staged injection around the perimeter creates containment barriers that stop material migration, allowing subsequent interior passes to establish uniform bearing across the panel.
- Grout Pressure Limiting Controls Relief valves calibrated below two hundred kilopascals prevent sudden pressure surges from shearing slab edges during pumping.
- Laser Level Volumetric Uplift Triggers Precision laser receivers trigger automatic pump shut-off once vertical elevation shifts by 0.25 millimeters.
- Hydrophobic Resin Expansion Ratios Hydro-insensitive polyurethanes preserve closed-cell structure and compressive stiffness even when expanding through water-saturated subgrades.
- Core Bond Shear Strength Metrics Core extraction verifies interface adhesion across the concrete-polymer-subgrade boundary to ensure uniform bearing.

Post Treatment Subgrade Modulus Verification
Quality assurance requires repeating deflectometer passes and impulse response testing across grouted floor areas. Post-remediation deflectometer data confirms restored joint efficiency and recalculates the updated modulus of subgrade reaction (k). Successful grouting raises degraded reaction values from twenty megapascals per meter back above sixty, re-establishing continuous bearing support.
Micro-coring through treated sections confirms material spread and verifies that voids at the slab-base interface have closed. Core samples illustrate penetration into subgrade pores and validate void filling. These verification cores confirm that stabilization has re-established uniform base contact, allowing the floor to be recertified for full operational traffic without equipment derating.
Attempting to correct curled slab corners with high injection pressures and no elevation monitoring invariably cracks panel interiors and binds dowel assemblies. Excessive pressure lifts the slab edge before resin can penetrate deeper voids, creating isolated fulcrums that concentrate wheel loads in new locations. Pumping at low pressures while tracking laser elevations allows expanding grout to fill the cavity uniformly without forcing the slab upward.


Recalibration
Recalibrating dynamic floor capacity following remediation establishes certified operational axle ratings for plant operations. Structural reassessments incorporate restored subgrade moduli, updated joint transfer efficiencies, and in-situ concrete flexural strengths into design capacity models. The resulting dossiers clarify whether bays can accommodate heavier automated guided vehicles, higher post loads from reconfigured racking, or faster forklift traffic.
Engineering documentation establishes explicit operational envelopes for facility maintenance teams and fleet managers. Permissible axle configurations are mapped directly onto plant floor plans, distinguishing unrestricted traffic routes from zones requiring speed limits or alternate pathing. Formal capacity recertification guards against fatigue cracking and preserves capital investments over the building’s operating life.
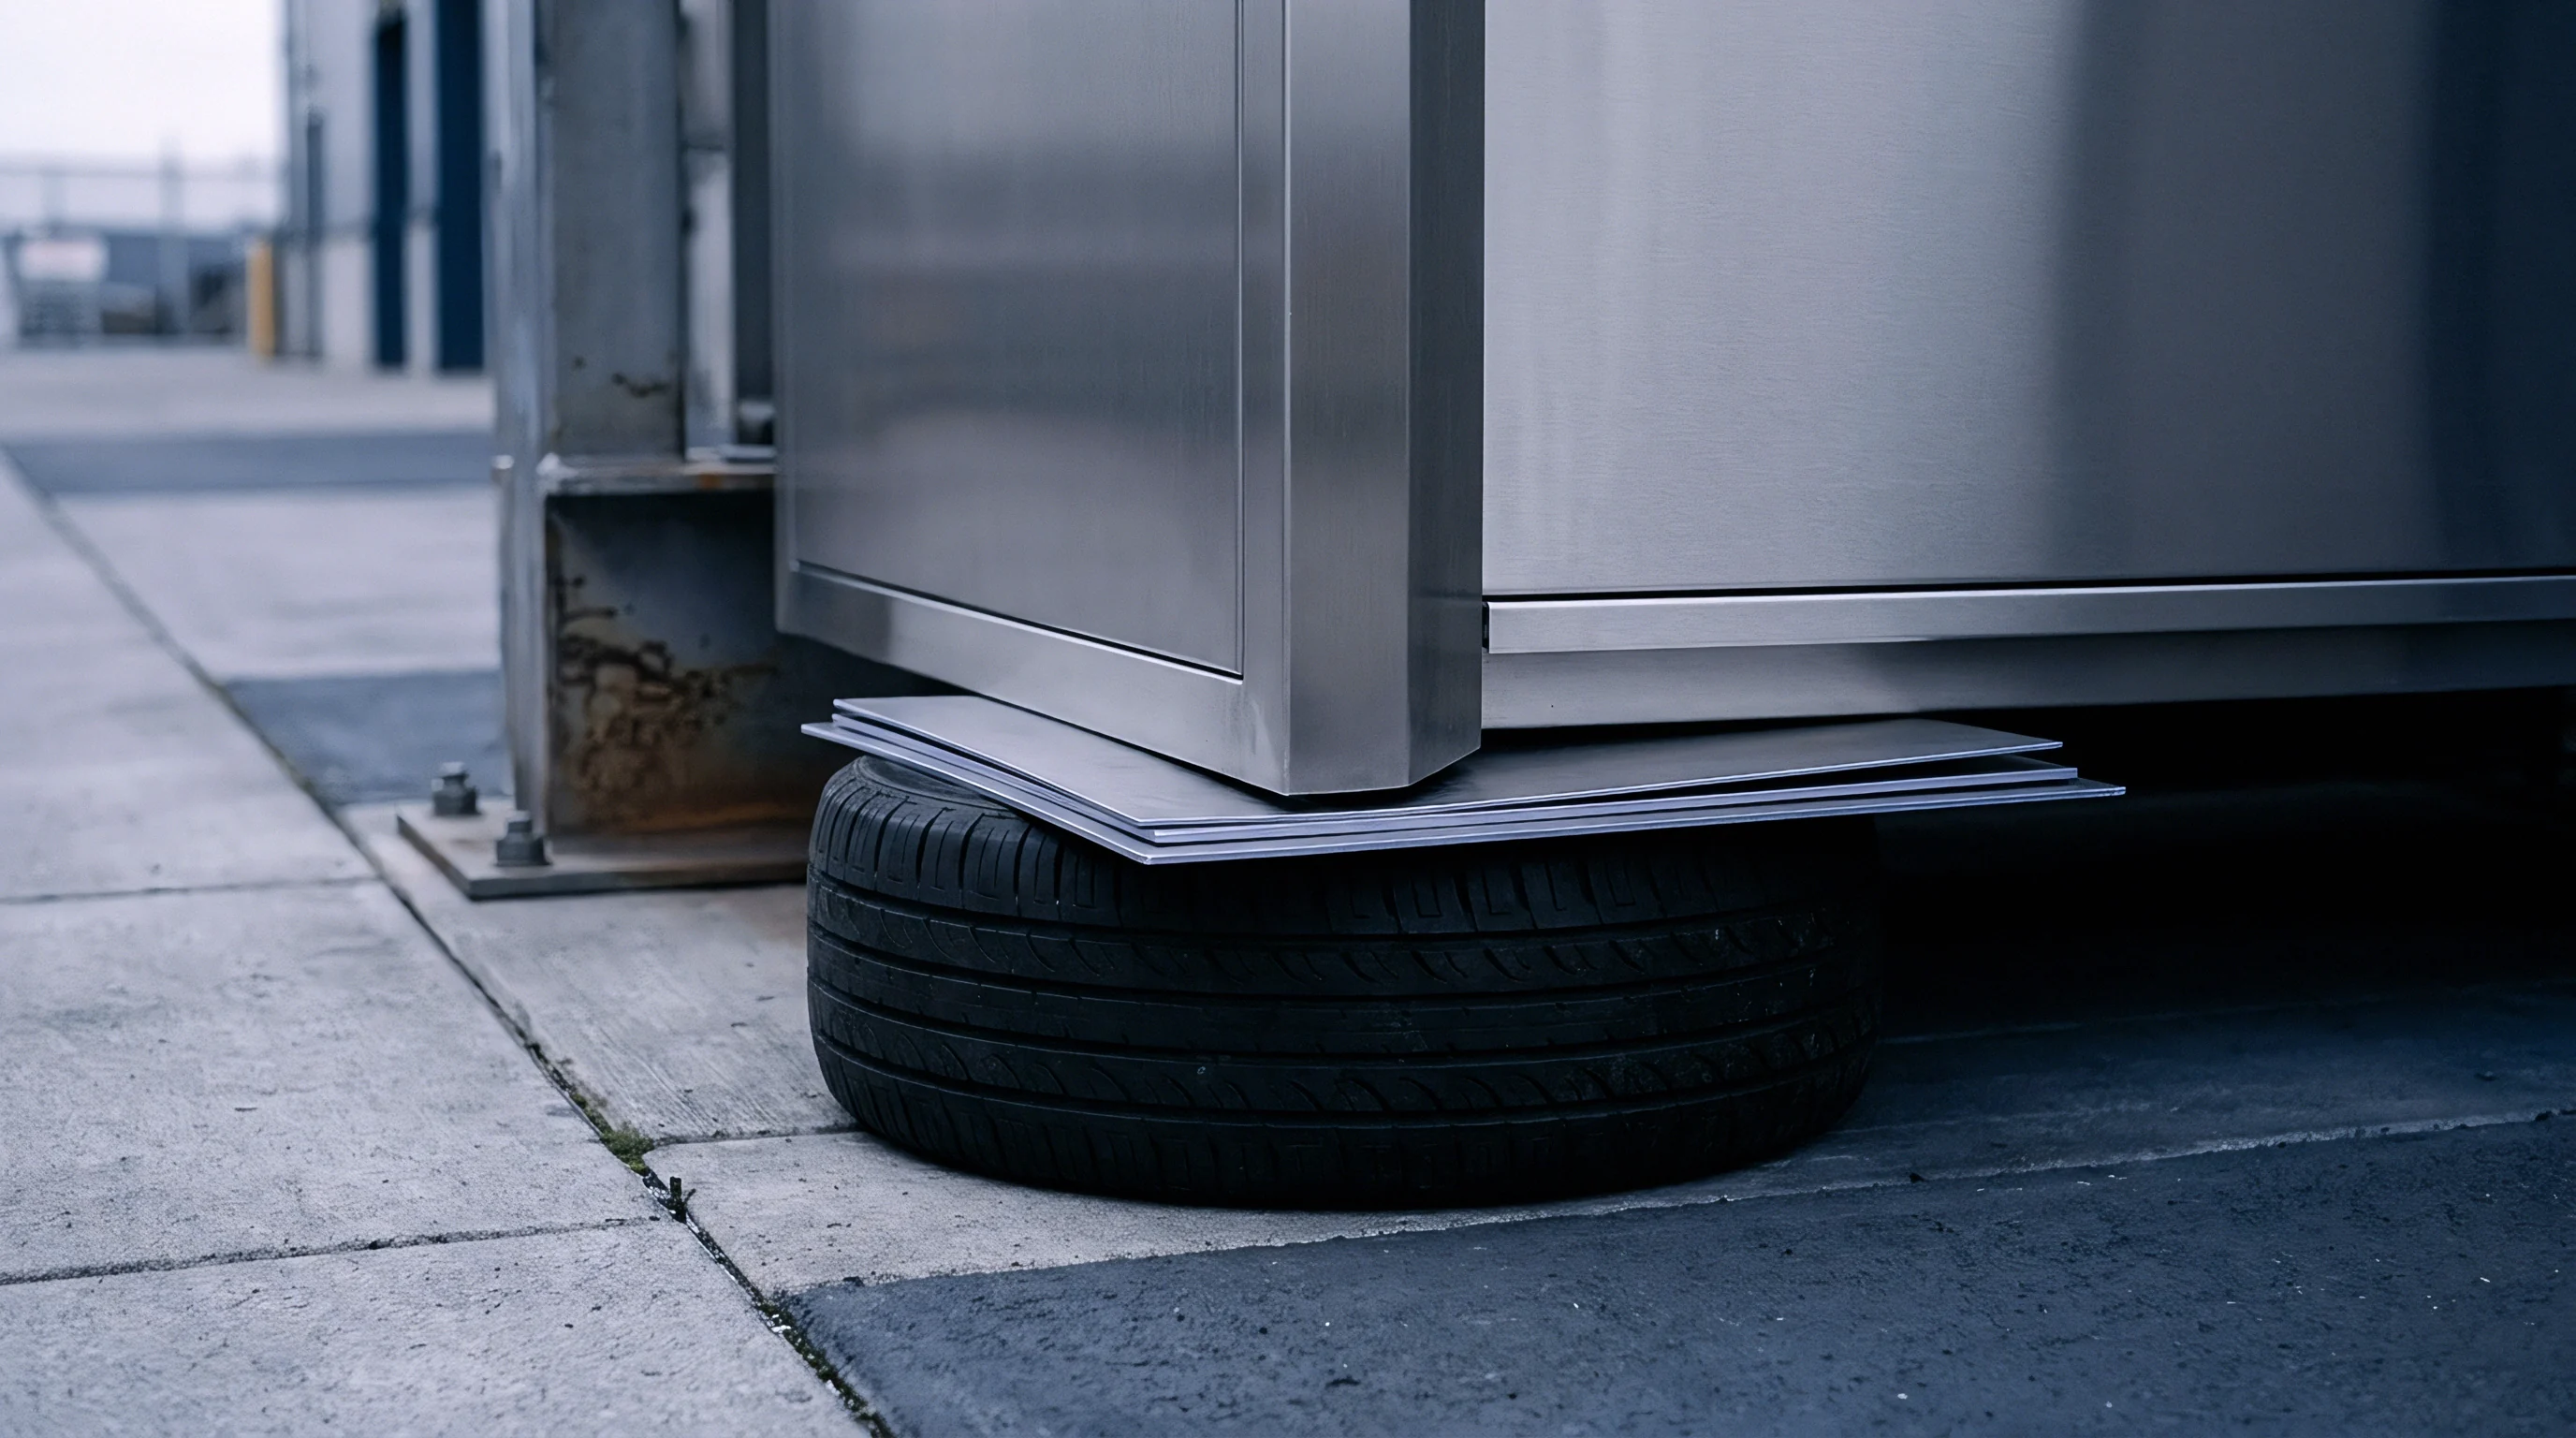
Post Remediation Floor Capacity Derating and Uprating Models
Capacity uprating relies on deflectometer datasets gathered once the injected material achieves full design cure. Restored subgrade moduli (k > 65 MPa/m) and renewed joint efficiencies (LTE > 80%) lower dynamic flexural tensile stresses during wheel impact. These reduced working stresses expand the calculated fatigue life envelope, justifying higher allowable wheel loads across treated panels.
Derating remains essential when permanent dowel socket enlargement or internal micro-cracking persists after voids are filled. If dowel looseness limits load transfer efficiency to sixty percent, axle load limits must be derated fifteen to twenty-five percent to maintain target structural safety factors. Operational remedies include mandatory vehicle speed limits, resilient tire specifications, or revised travel paths to reduce dynamic impact across compromised joints.

Dynamic Wheel Load Envelope Adjustment Procedures
Setting operational load envelopes requires matching vehicle kinematic profiles against recalibrated slab capacities. Axle spacing, tire footprint dimensions, travel velocities, and turn radii determine localized shear distributions across the joint grid. Facility managers rely on these recalibrated envelopes to evaluate proposed equipment upgrades before purchasing heavier material handling machinery or converting to high-density racking.
Periodic deflection testing tracks structural performance under long-term warehouse traffic. Annual falling weight deflectometer testing along primary travel aisles identifies early subbase softening or joint play before voids trigger slab fractures. In critical high-throughput facilities, embedded strain gauges provide continuous load-response data, validating floor capacity across varying operational cycles.

Operational Sign off and Continuous Deflection Monitoring
Structural qualification requires compiling non-destructive mapping, core logs, grout placement records, and post-remediation deflectometer surveys into an engineering dossier. A licensed engineer evaluates these datasets, certifies revised floor rating plans, and issues stamped sign-off documents governing allowable facility loads.
- Baseline Impulse Response Spectra Documents Acoustic surveys recorded prior to remediation define mobility and dynamic stiffness baselines across all bays.
- Subgrade Modulus Restoration Certificates Deflectometer verification documents that restored subgrade reaction moduli satisfy design criteria.
- Joint Efficiency Deflection Maps Deflection mapping illustrates post-grouting load transfer efficiencies across all transverse and longitudinal joints.
- Axle Load Limit Sign Off Records Stamped documentation sets safe vehicle axle weights, wheel contact pressures, and transit speed thresholds.
Routine deflection monitoring schedules reflect traffic intensity and vehicle weights across the building footprint. Main transit aisles seeing more than one thousand passes per day receive deflectometer evaluations every twenty-four months, whereas low-traffic rack bays require testing every sixty months. Catching subgrade degradation early permits targeted, low-pressure grout injection, heading off major joint failures, operational disruptions, and total slab replacement.