First Pass Yield Optimization Strategies for High Velocity Assembly Lines
Optimizing first pass yield on high velocity lines requires real-time closed-loop metrology, tight station capability limits, and strict poka-yoke gates.

Pulse
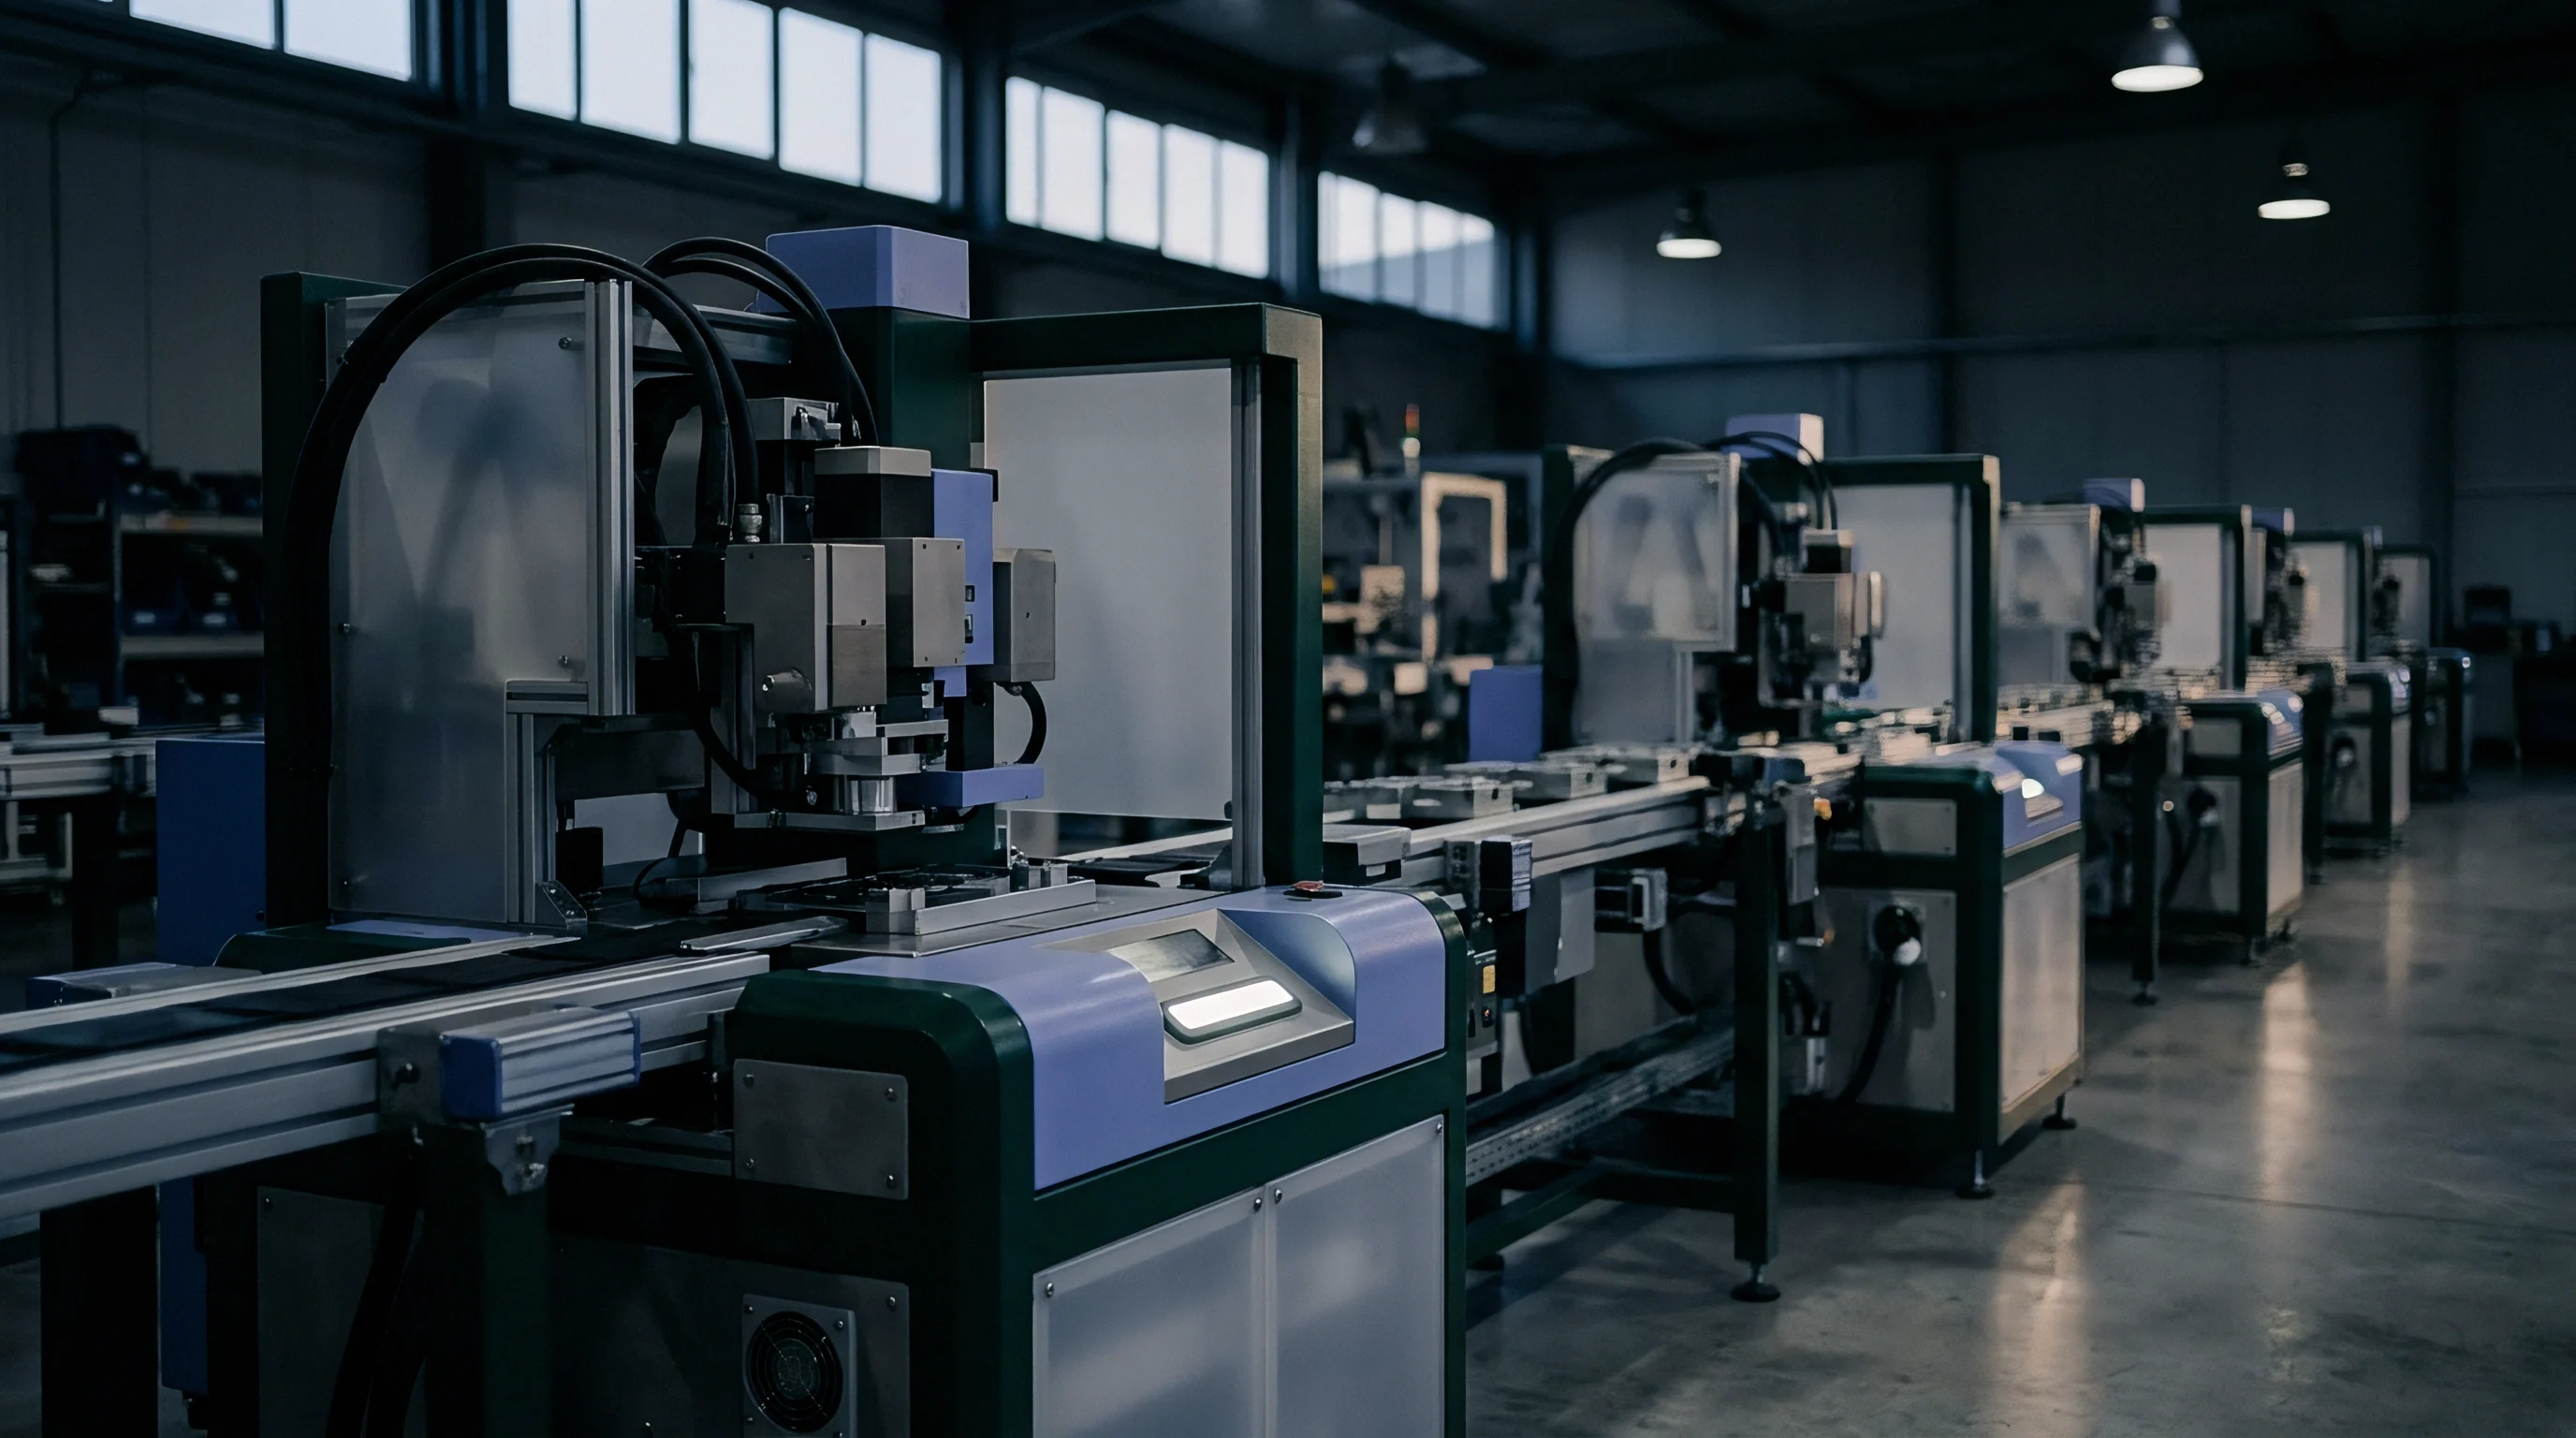
High-velocity manufacturing lines running above sixty units per minute expose structural yield vulnerabilities that stay hidden at lower operating speeds. When individual station yields sit at 99.2 percent across a fourteen-station automated assembly sequence, net defect-free output falls to 89.1 percent. Units pass through automated feeding, alignment, dispensing, pressing, and inspection modules without interruption, so late-stage test stations catch minor defects introduced twelve steps earlier and mask where the failure actually started.

Kinetic Variability and Yield Degradation Dynamics
Accelerating line speed introduces mechanical chatter, pneumatic pressure drops, and thermal expansion across automated tooling interfaces. At cycle times under eight hundred milliseconds, micro-stoppages lasting under two seconds shift material positioning just enough to cause problems. For instance, a minor pressure drop of five kilopascals in pneumatic grippers alters clamping force vectors enough to misalign component insertion by fifty micrometers, compounding yield losses across subsequent stations.
Continuous vibration causes feeder alignment to drift. As feeding mechanisms slip, surface mount devices and mechanical fasteners seat at subtle angles. Downstream vision systems often miss these marginal insertions if they pass electrical continuity checks, even though they fail mechanical durability limits.
Defects then pass quietly through intermediate stations, compounding rework costs before reaching final testing.

Rolled First Pass Yield Cascades across High Velocity Stations
Overall output efficiency relies directly on the mathematical product of individual workstation yields. Calculating rolled yield isolates how defect propagation compounds across automated manufacturing environments:
RFPY = Y1 x Y2 x Y3 x. x Yn
A ten-station line maintaining 99.5 percent first-pass yield at each station delivers a net rolled output of 95.1 percent. Expanding that same production line to twenty-five stations at identical individual performance drops rolled output to 88.2 percent. High-velocity lines amplify this loss because rapid cycle rates generate hundreds of scrap or rework units before automated diagnostics detect a parameter drift.
Thermal expansion alters mechanical baseline positions over time. When timing drifts on upstream actuators go uncorrected, downstream optical inspection systems end up evaluating misaligned components, triggering false-reject cascades that tie up offline rework capacity.


Joint
Interconnect integrity is often the primary structural bottleneck in high-speed mechanical and electronic manufacturing. Fasteners, crimps, laser welds, and solder joints must achieve full material bonding within cycle windows measured in milliseconds. Process drift during joining operations produces latent field failures that pass initial end-of-line electrical verification.
Mechanical Fastening and Thermal Interface Imperfections
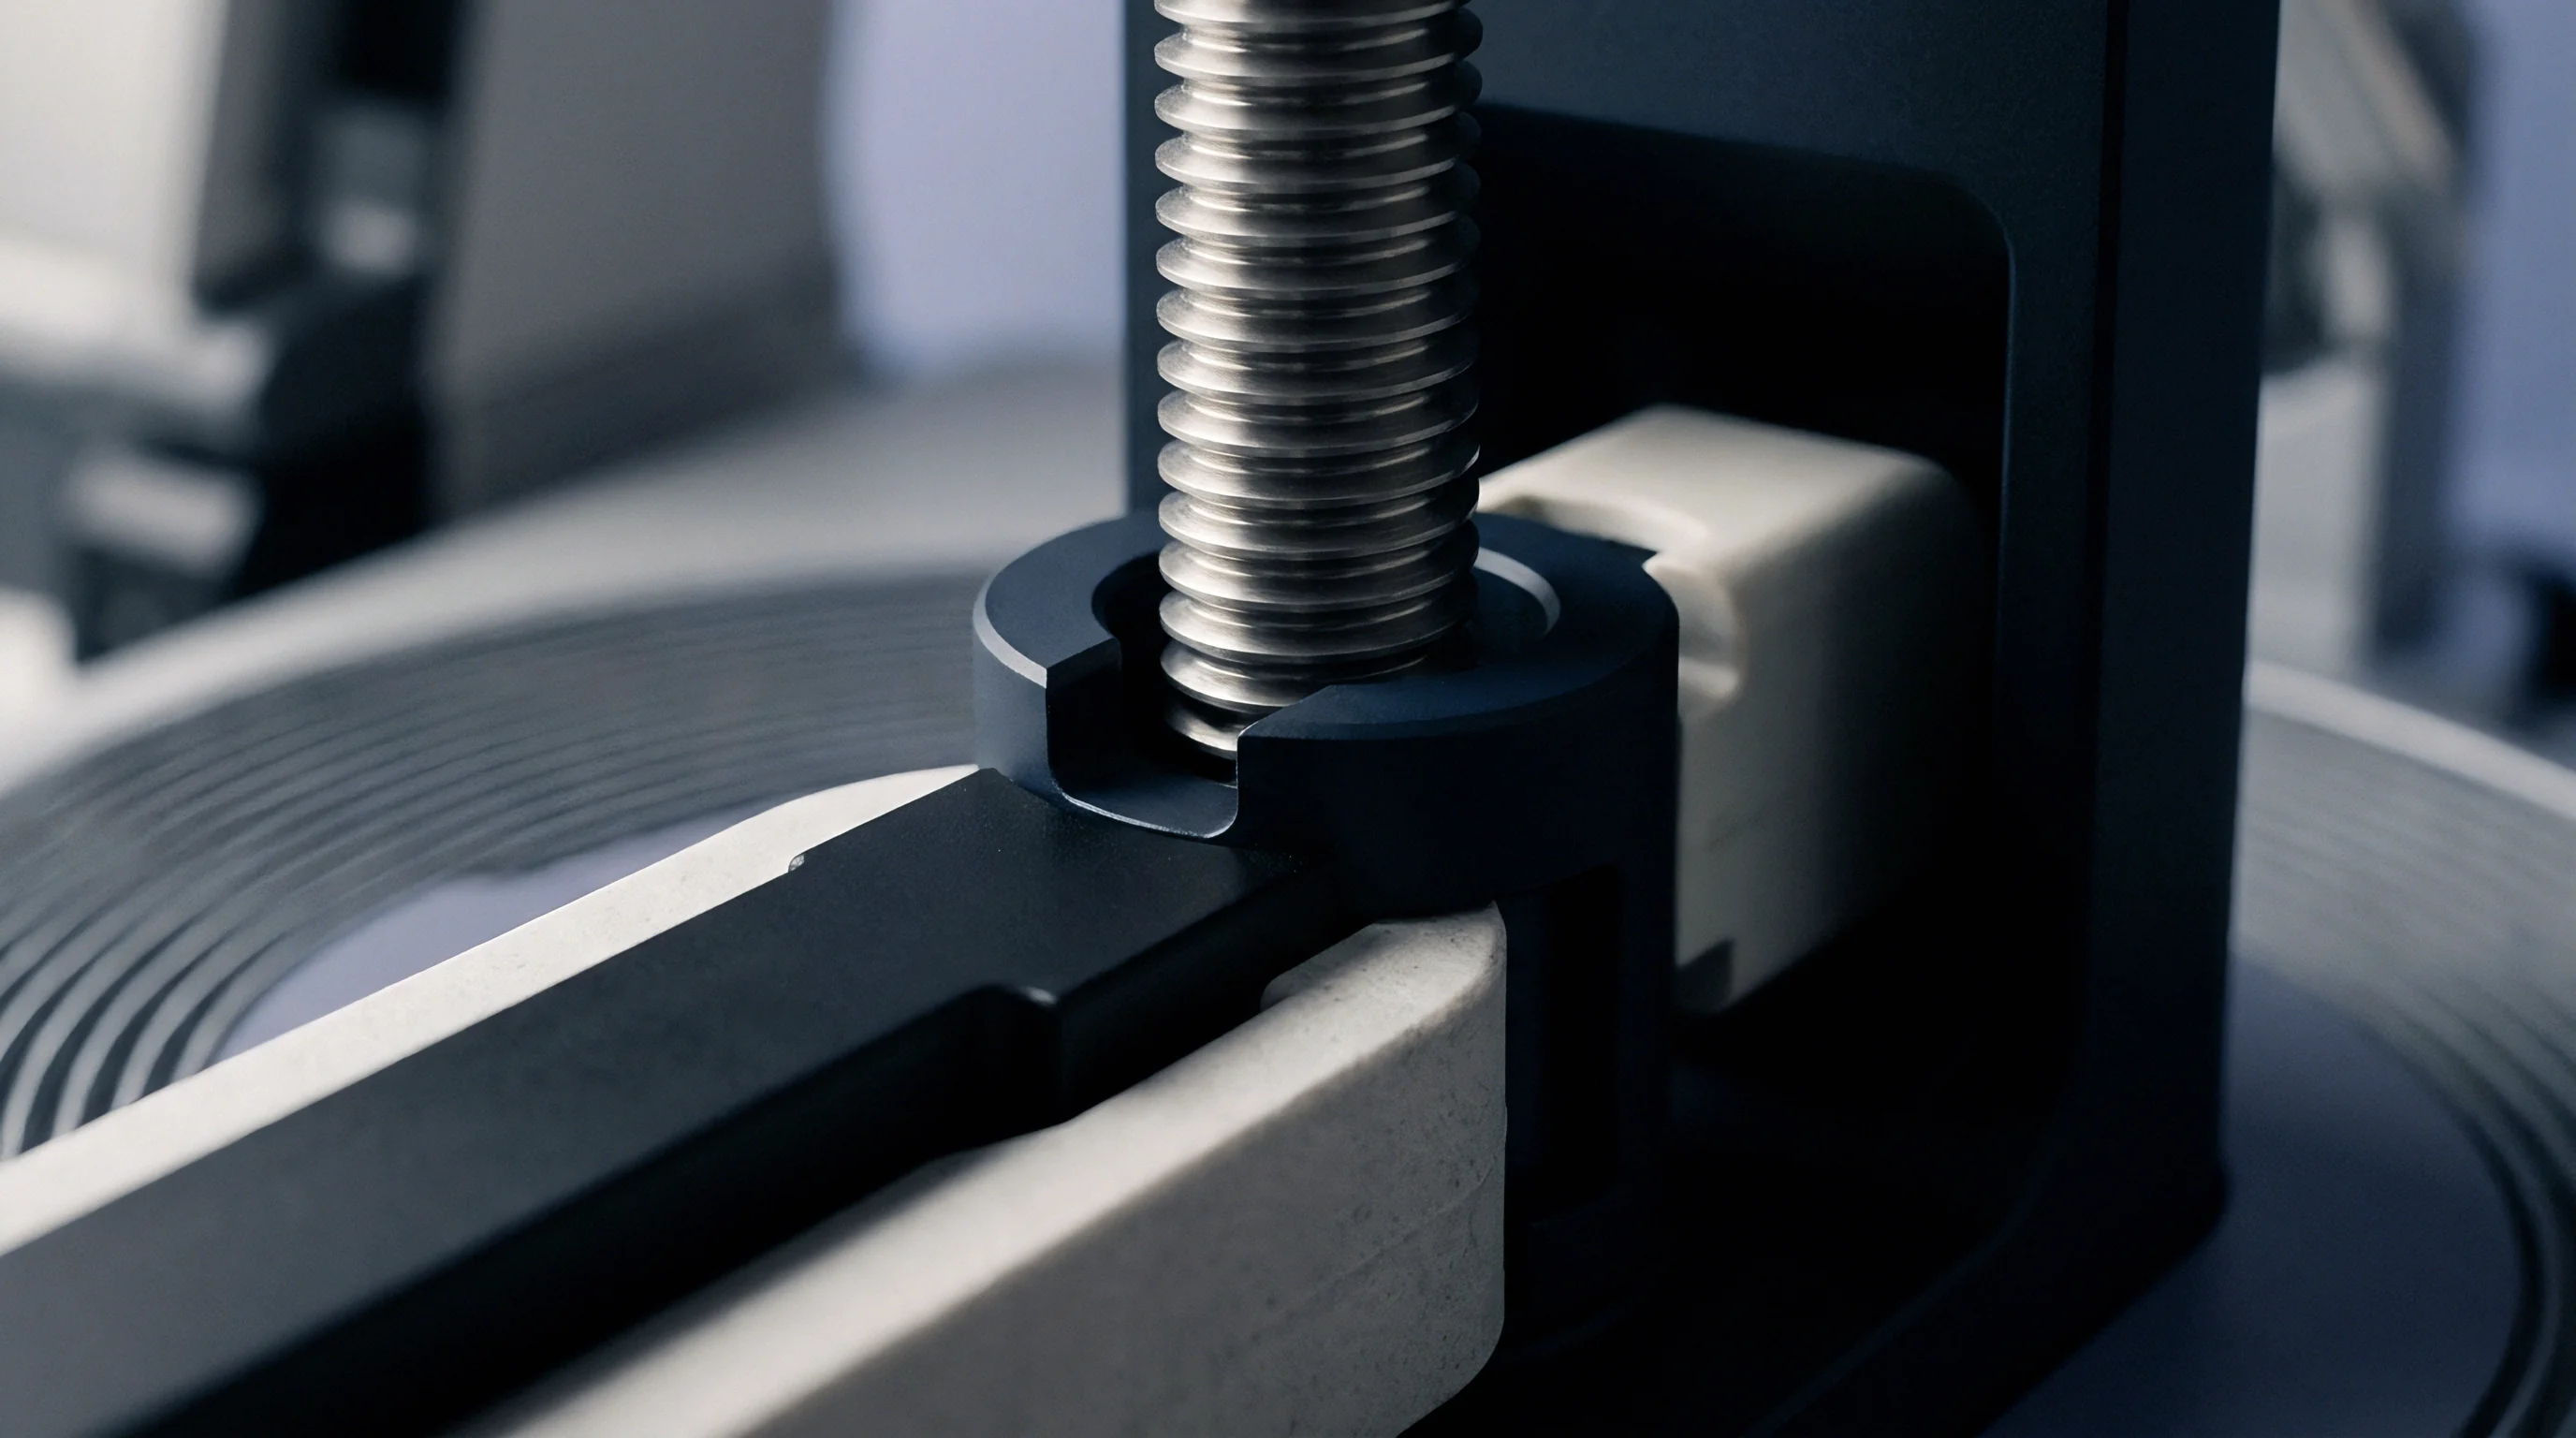
Automated screwdriving modules running at three thousand revolutions per minute generate friction heat that expands aluminum motor housings during continuous runs. As motor windings heat up, torque sensors tied to current-draw monitoring suffer calibration skew, while force sensors log transient pressure spikes.
At high line rates, thermal interface materials trap microscopic air pockets if dispensing valve actuation outpaces fluid relaxation times. Dispensing pumps running at eighty cycles per minute require precise back-pressure compensation to keep volumetric tolerances within two percent. Dropping fluid pressure leaves voids under thermal spreaders, creating localized hot spots that ruin electronic control modules during burn-in testing.
High Speed Solder Interconnect and Weld Integrity Metrics
Laser welding battery tab terminals at high line rates demands sub-millisecond beam profile control. Power density fluctuations of just three percent alter melt pool depth, causing either incomplete penetration or copper burn-through. Depositing solder paste for surface mount components requires continuous paste viscosity management across high-speed stencils.
| Joining Method | Primary Defect Mechanism | Root Cause Parameter Drift | Yield Impact Range |
|---|---|---|---|
| Automated Threaded Fastening | Cross-threading and Strip Torque | Spindle speed mismatch and axis mis-alignment | 1.2% to 3.5% reject rate |
| Laser Tab Welding | Micro-voiding and Underbead Crack | Laser optics contamination and gas shield drop | 0.8% to 2.1% reject rate |
| Automated Terminal Crimping | Bell-mouth distortion and asymmetry | Crimping die wear and wire strand splay | 0.5% to 1.8% reject rate |
| Dispensing Thermal Paste | Volumetric voiding and line tailing | Fluid viscosity shift from shear heating | 1.5% to 4.2% reject rate |
High-speed joint formation fails when mechanical positioning tolerances conflict with sub-millisecond process windows.
Terminal crimping presses running at high strokes per minute develop mechanical play in guide channels after three million cycles. Tooling wear widens crimp height distributions beyond specified automotive standards. Intermittent crimp height variations can stem from either inconsistent raw terminal hardness or mechanical play within press tooling guide channels.


Buffer
In-line metrology catches process variation before defective sub-assemblies reach downstream stations. High-velocity lines combine automated optical inspection, three-dimensional solder paste measurement, and automated X-ray analysis to capture real-time dimensional data. Placing buffer zones directly after key joining stations keeps defective units out of downstream work cells.

Is Inline Optical Inspection Sufficient for Hidden Defect Detection?
Conveyor-mounted camera systems capture surface geometry, but they cannot detect subsurface voiding in structural adhesives or solder matrices beneath ball grid arrays. High-resolution three-dimensional cameras running at hundred-frame-per-second capture rates require intense light flashes that generate sensor noise over extended shifts, while surface reflectivity skews optical height calculations.
Automated X-ray inspection modules reveal internal structural voids but add cycle time delays. Fitting inline X-ray verification into sixty-unit-per-minute lines requires splitting transport tracks into parallel inspection bays, adding mechanical divert units that create extra failure points.
Closed Loop Metrology and Downstream Defect Containment
Direct communication between inspection nodes and upstream production tooling enables automated self-correction. When a downstream vision sensor detects a mean positional offset shift exceeding fifteen micrometers over twenty consecutive units, the system transmits offset correction coordinates back to the upstream pick-and-place robot.
Metrology systems integrated into high-speed lines encounter specific hardware and processing limitations during continuous operation:
- Optical occlusion from fast component motion degrades camera resolution during rapid board transfers, masking micro-solder bridges.
- Lattice micro-cracking under rapid thermal cycles escapes visual detection during automated inspection and manifests only under load testing.
- Sensor drift during extended production runs introduces measurement offsets that skew process mean values away from nominal centerlines.
- Data bus saturation at high sampling frequency forces inspection systems to drop image frames during peak throughput bursts.
An inspection node placed after a non-reversible manufacturing step prevents compound scrap costs from accumulating in subsequent stations.
It remains unclear whether real-time neural network image processing can completely eliminate false positives caused by surface reflectivity variance without slowing line transport speeds.

Docket
Process capability metrics quantify line stability under high cycle rates. Standard statistical process control methods relying on manual sample collection fail on high-velocity lines, where a five-minute measurement delay permits hundreds of out-of-spec units to pass through the line. Continuous parametric data logging records critical dimensional, electrical, and force characteristics for every manufactured serial number.

Statistical Control Limits in High Speed Electronic and Mechanical Assembly
Control limits set at three standard deviations from historical means must adjust dynamically to account for batch material variation and environmental shifts. When raw material lots transition, raw sheet metal thickness or component lead solderability fluctuates within commercial specification limits, altering baseline process distributions. Control limits narrow as sampling rates increase.
High-velocity data collection relies on calculating upper and lower control limits over rolling five-hundred-unit windows. Sub-grouping strategies must cluster consecutive units produced within short time frames to separate short-term machine vibration noise from long-term thermal tool wear trends.
Process Capability Calculations across Ten Thousand Unit Batches
Consider a high-velocity line producing 10,000 electronic actuator assemblies per shift across ten sequential automated stations. Evaluating yield outcomes requires comparing two operating regimes: Regime A operating at a Cpk of 1.33, and Regime B optimized to a Cpk of 1.67 under tighter thermal and mechanical controls.
Under Regime A, a Cpk of 1.33 corresponds to a station-level defect rate of 64 parts per million (PPM). Across ten sequential stations, assuming independent defect probabilities, the total line failure rate reaches 640 PPM. In a 10,000-unit production run, this yields 6.4 defective units, translating to a rolled first-pass yield of 99.936 percent.
Under Regime B, raising process capability to a Cpk of 1.67 reduces individual station defect rates to 0.54 PPM. Across ten stations, total defects drop to 5.4 PPM per run. Out of 10,000 units, the line produces 0.054 defective units, achieving a rolled first-pass yield of 99.9946 percent.
If thermal drift degrades Cpk to 1.00 (2,700 PPM per station), line defects rise to 27,000 PPM, dropping rolled first-pass yield to 97.33 percent and generating 267 scrapped units per shift.
| Capability Index (Cpk) | Single Station Defect Rate (PPM) | Ten Station Rolled Yield (%) | Shift Defect Count (10,000 Units) |
|---|---|---|---|
| 1.00 | 2,700.00 | 97.3300 | 267.00 |
| 1.33 | 64.00 | 99.9360 | 6.40 |
| 1.50 | 6.80 | 99.9932 | 0.68 |
| 1.67 | 0.54 | 99.9946 | 0.05 |
| 2.00 | 0.002 | 99.9999 | 0.00 |
| Assumes normal distribution of critical dimensions and independent defect probabilities across ten stations. | |||
Thermal load expands process variance. Section 9.1.1.1 of IATF 16949 obligates suppliers to maintain process capability above a Cpk of 1.33 for all critical safety characteristics, penalizing non-compliant lines with mandatory one-hundred percent manual inspection protocols.


Stack
Error-proofing mechanisms integrated into high-velocity assembly hardware prevent defect generation at the source. Effective poka-yoke designs integrate physical locators, asymmetrical guide pins, and proximity sensors directly into pallet fixtures, though pallet wear can still introduce positional offset errors over time.

Poka Yoke Integration Order across Sequential Assembly Workstations
Installing physical error-proofing devices requires a strict sequence aligned with component assembly hierarchy. Mechanical interlocks must sit upstream of all non-reversible assembly operations such as crimping, adhesive curing, or laser riveting. Implementing optical detection after fluid dispensing ensures correct bead continuity before mating housing components press down.
Mechanical locators lose precision as they wear. Sensor-based poka-yoke modules verifying connector pin presence must execute signal checks within fifty milliseconds to prevent holding up pallet transfer systems. Integrating proximity sensors into high-speed grippers provides instantaneous confirmation of part seizure before the robot arm initiates motion across the transport track.
Physical Tolerance Accumulation and Inter Station Alignment
Accumulating dimensional variances across sequential stations creates alignment errors at final assembly. Individual component tolerances of plus or minus twenty micrometers combine across five sub-assembly steps to produce a potential overall variance of one hundred micrometers. Pallet transport systems must utilize hard locating pins at every workstation to reset positional baselines.
Line supervisors maintain strict adherence to mechanical setup procedures to prevent cumulative tolerance buildup along high-speed conveyors:
- Map station-by-station dimensional tolerances against finished unit clearance envelope limits to isolate compound misalignment sources.
- Position vision sensors prior to non-reversible joining operations to isolate sub-assembly dimensional variances before permanent attachment.
- Calibrate mechanical locating pins at four-hour operational intervals during shift runs to eliminate fixture wear drift.
- Implement physical interlocks that halt pallet transport tracks whenever automated vision systems detect missing threaded fasteners.
Achieving a six-sigma process capability index of 2.0 at seventy-two units per minute holds component dimensional variance within three micrometers across a continuous eight-hour run.
Mechanical error-proofing that physically prevents incorrect part orientation provides greater operational stability than software alerts dependent on operator intervention.

Receipt
Cost of quality calculations establish the ultimate commercial boundary for yield optimization investments. High-velocity operations must balance capital expenditure on advanced automated metrology against internal failure costs like scrap disposal and offline rework labor. Scrap costs multiply late in assembly sequences.
Financial Trade Offs between Internal Rework and Scrap Allocation
Rework labor consumes operating gross margins. Scrapping a sub-assembly at station two incurs minimal material loss, while scrapping a fully populated control module at station twelve forfeits significant added value in component content and labor input. High-speed lines require clear financial threshold models to decide whether a defective unit routes to manual rework or automatic scrap ejection.
Manual rework on high-density surface mount assemblies introduces heat damage risks to adjacent components, frequently reducing the reliability of repaired units. When rework success rates drop below eighty-five percent, scrapping non-conforming units directly at the station of defect origin preserves overall line margin by avoiding wasted technician hours.

Stage Gate Criteria for Escalating Assembly Line Velocity
Increasing assembly line speed requires disciplined stage-gate validation to prevent catastrophic yield collapses. Escalating velocity from forty to sixty or eighty units per minute demands formal sign-off across physical, statistical, and software criteria.
Quality engineering teams enforce specific gate parameters before authorizing line speed increases on high-velocity production systems:
- Station level rolled yield threshold clearance requires every individual operation to demonstrate ninety-nine point eight percent yield over three consecutive shifts.
- Automated trace data capture confirmation validates that all parametric serial numbers register in the database without dropped packets.
- Measurement system repeatability and reproducibility compliance demands gauge repeatability values below ten percent for every automated inline sensor.
- Containment buffer capacity validation ensures rejection spurs accept maximum line output for fifteen minutes without triggering line stoppages.
Clause 8.5.1 of ISO 9001 revokes production release authorization when automated control plans lack recorded validation for high-speed sensor recalibration cycles.
Escalating line velocity without verifying station capability causes exponential defect multiplier effects. Plant management protects operating margins by locking ramp rate approvals behind rigorous gage repeatability records and station-level rolled yield thresholds.