Evaluating Line Interdependencies Prior to Equipment Contract Execution
Evaluating line interdependencies prevents capex write-downs by sizing buffers, auditing handoffs, and binding multi-vendor contracts to combined output rates.


Coupling
Fixed mechanical indexing pins lock sequential stations into an inflexible operational chain. When procurement teams evaluate machinery as standalone catalog items, rated output numbers create an expensive operational illusion. A stamping press operating at sixty cycles per minute cannot deliver sixty finished assemblies per minute if the downstream transfer shuttle runs at fifty-eight cycles per minute.
The slower unit imposes an immediate physical ceiling on the preceding asset. Upstream workpieces accumulate on gravity tracks, trip proximity sensors, and trigger automated dwell states that halt the press motor.
Line balance dictates gross output. Machine builders quote nominal speeds based on isolated shop-floor acceptance dry runs conducted without upstream parts starvation or downstream backpressure. Connecting four machines with individual availability ratings of ninety-five percent yields an aggregate line availability of eighty-one percent when zero intermediate accumulation separates the units.
The operational uptime of an uncoupled system behaves as the mathematical product of the standalone availability figures of each serialized element.
Interlocking high-speed automated stations without decouple accumulation transforms the reliability of the line into the product of every individual machine availability.
Capital commitments freeze line geometry. When purchase orders are issued to separate vendors for component insertion, ultrasonic welding, laser marking, and cartoning, each supplier tests their machine against clean, uniform coupons in a sterile build room. None of those factory acceptance protocols reflect the dimensional variance of actual production stock, the heat dissipation profiles of continuous operation, or the micro-stoppages caused by downstream packaging material jams.
Evaluating interdependencies prior to signing equipment contracts requires mapping the physical flow velocities, accumulator capacities, and transfer kinematics across every physical interface.

Synchronous Transfer Line Mechanics
Rigid workpiece carriers govern instantaneous part velocity across synchronous automated cells. In a walking-beam or rotary dial transfer system, every processing head completes its stroke before the common mechanical drive advances the nest. A single drill spindle experiencing thermal expansion or chip binding delays the entire index table.
Unbuffered lines multiply individual failure. The line runs at the speed of the slowest action on the slowest station during that exact cycle.
Cycle variation compounds rapidly across multi-axis pneumatic actuators. A parts placer rated at 1.2 seconds nominal index time routinely experiences cycle drift up to 1.6 seconds as valve seals wear and line air pressure drops from 6.2 bar to 5.4 bar during peak plant demand. If the downstream riveting unit operates on a strict 1.3-second cycle window without an adaptive sensor handshake, the riveter fires into an empty fixture.
The tooling damages the anvil, halts the cell, and generates thirty minutes of mechanical reset time.

Line Throughput versus Isolated Machine Ratings
Equipment suppliers present technical bids based on standalone cycle efficiency. An injection molding machine supplier quotes a twenty-two-second cure-and-eject cycle, while the end-of-arm robotics vendor specifies a three-second transfer time, and the degating station vendor claims a four-second trim cycle. Production buyers routinely add these intervals together and calculate a theoretical output of one hundred twenty units per hour.
The realized plant floor rate regularly lands below eighty-five units per hour.
Transfer latencies between disparate vendor programmable logic controllers consume unaccounted operational margin. Latency compounds across serial cells. Signal handshakes across Ethernet/IP or Profinet networks require safety circuit verification, vacuum grip confirmation, and mechanical clearance confirmations that add two hundred to six hundred milliseconds per transfer motion.
Over sixteen hours of continuous production, those unmodeled half-second pauses accumulate into thousands of units of missing volume. Signing equipment procurement contracts without establishing line interdependency metrics locks the production facility into permanent throughput shortfalls, inflated inventory holding expenses, and contentious multi-vendor warranty litigation.


Starvation
Empty conveyor lanes upstream bring high-speed assembly spindles to a dead stop. When a primary feeder bowl jams on foreign particulate or bent fastener pins, the downstream screw-driving station sits idle within three cycles. Machine starvation occurs whenever a downstream process lacks input stock despite possessing full mechanical availability to cycle.
The upstream equipment keeps running while the downstream tool starves, or the upstream asset continues cycling until intermediate channels fill and force an upstream blockage.
Blocking and starvation operate as twin operational parasites across serialized production lines. Downstream blocking forces an operational asset to withhold its completed workpiece because the exit conveyor or subsequent fixture remains occupied. The station holds the part, cools below nominal operating temperature, and wastes utility power while waiting for line clearance.
Upstream starvation starves downstream assets of feed material, forcing servos to ramp down and vacuum generators to run unloaded.
| Station Function | Isolated Cycle Time (s) | Intermediate Buffer (units) | Realized Throughput (units/hr) | Coupling Loss (%) |
|---|---|---|---|---|
| Primary Stamping | 1.0 | 0 | 2,160 | 40.0 |
| Secondary Degreasing | 1.2 | 15 | 2,480 | 17.3 |
| Laser Weld Nest | 1.1 | 50 | 2,820 | 12.4 |
| Vision Inspection | 0.9 | 10 | 2,800 | 13.0 |
| Final Packout | 1.3 | 100 | 2,650 | 4.3 |

Downstream Blocking and Upstream Depletion
Accumulation tracks between dissimilar operations balance out minor process variations. Without sufficient physical buffer lengths, a forty-five-second tool clean on an ultrasonic bonder starves the downstream testing carousel within three cycles. The tester sits empty, cooling its optical sensors, while the bonder operator clears slag.
The line balance shatters completely.
Unbalanced cycle times create backpressure. When Station 2 takes 1.4 seconds and Station 3 takes 1.1 seconds, parts back up immediately behind Station 3. If the conveyor carries only five parts of physical accumulation, Station 2 stops cycling every twenty seconds to wait for space.
The continuous stop-start sequence accelerates clutch wear, spikes peak electrical current draws, and increases mechanical fatigue on indexer drives.
- Micro Stop Accumulation converts brief three-second feeder hesitations into extended ten-minute downstream line clearances as pneumatic cylinders fault out on timeout thresholds.
- Thermal Cycling Drift alters critical press and sealer temperatures during unplanned starvation pauses, generating out-of-spec parts upon automated cycle resumption.
- Conveyor Belt Scuffing damages cosmetic product surfaces when stalled workpieces remain resting on continuously running friction rollers behind blocked workstations.
- Purge Cycle Invocations dump expensive mixed resin or reactive adhesive onto waste conveyors whenever line stoppages exceed maximum chemical pot life limits.
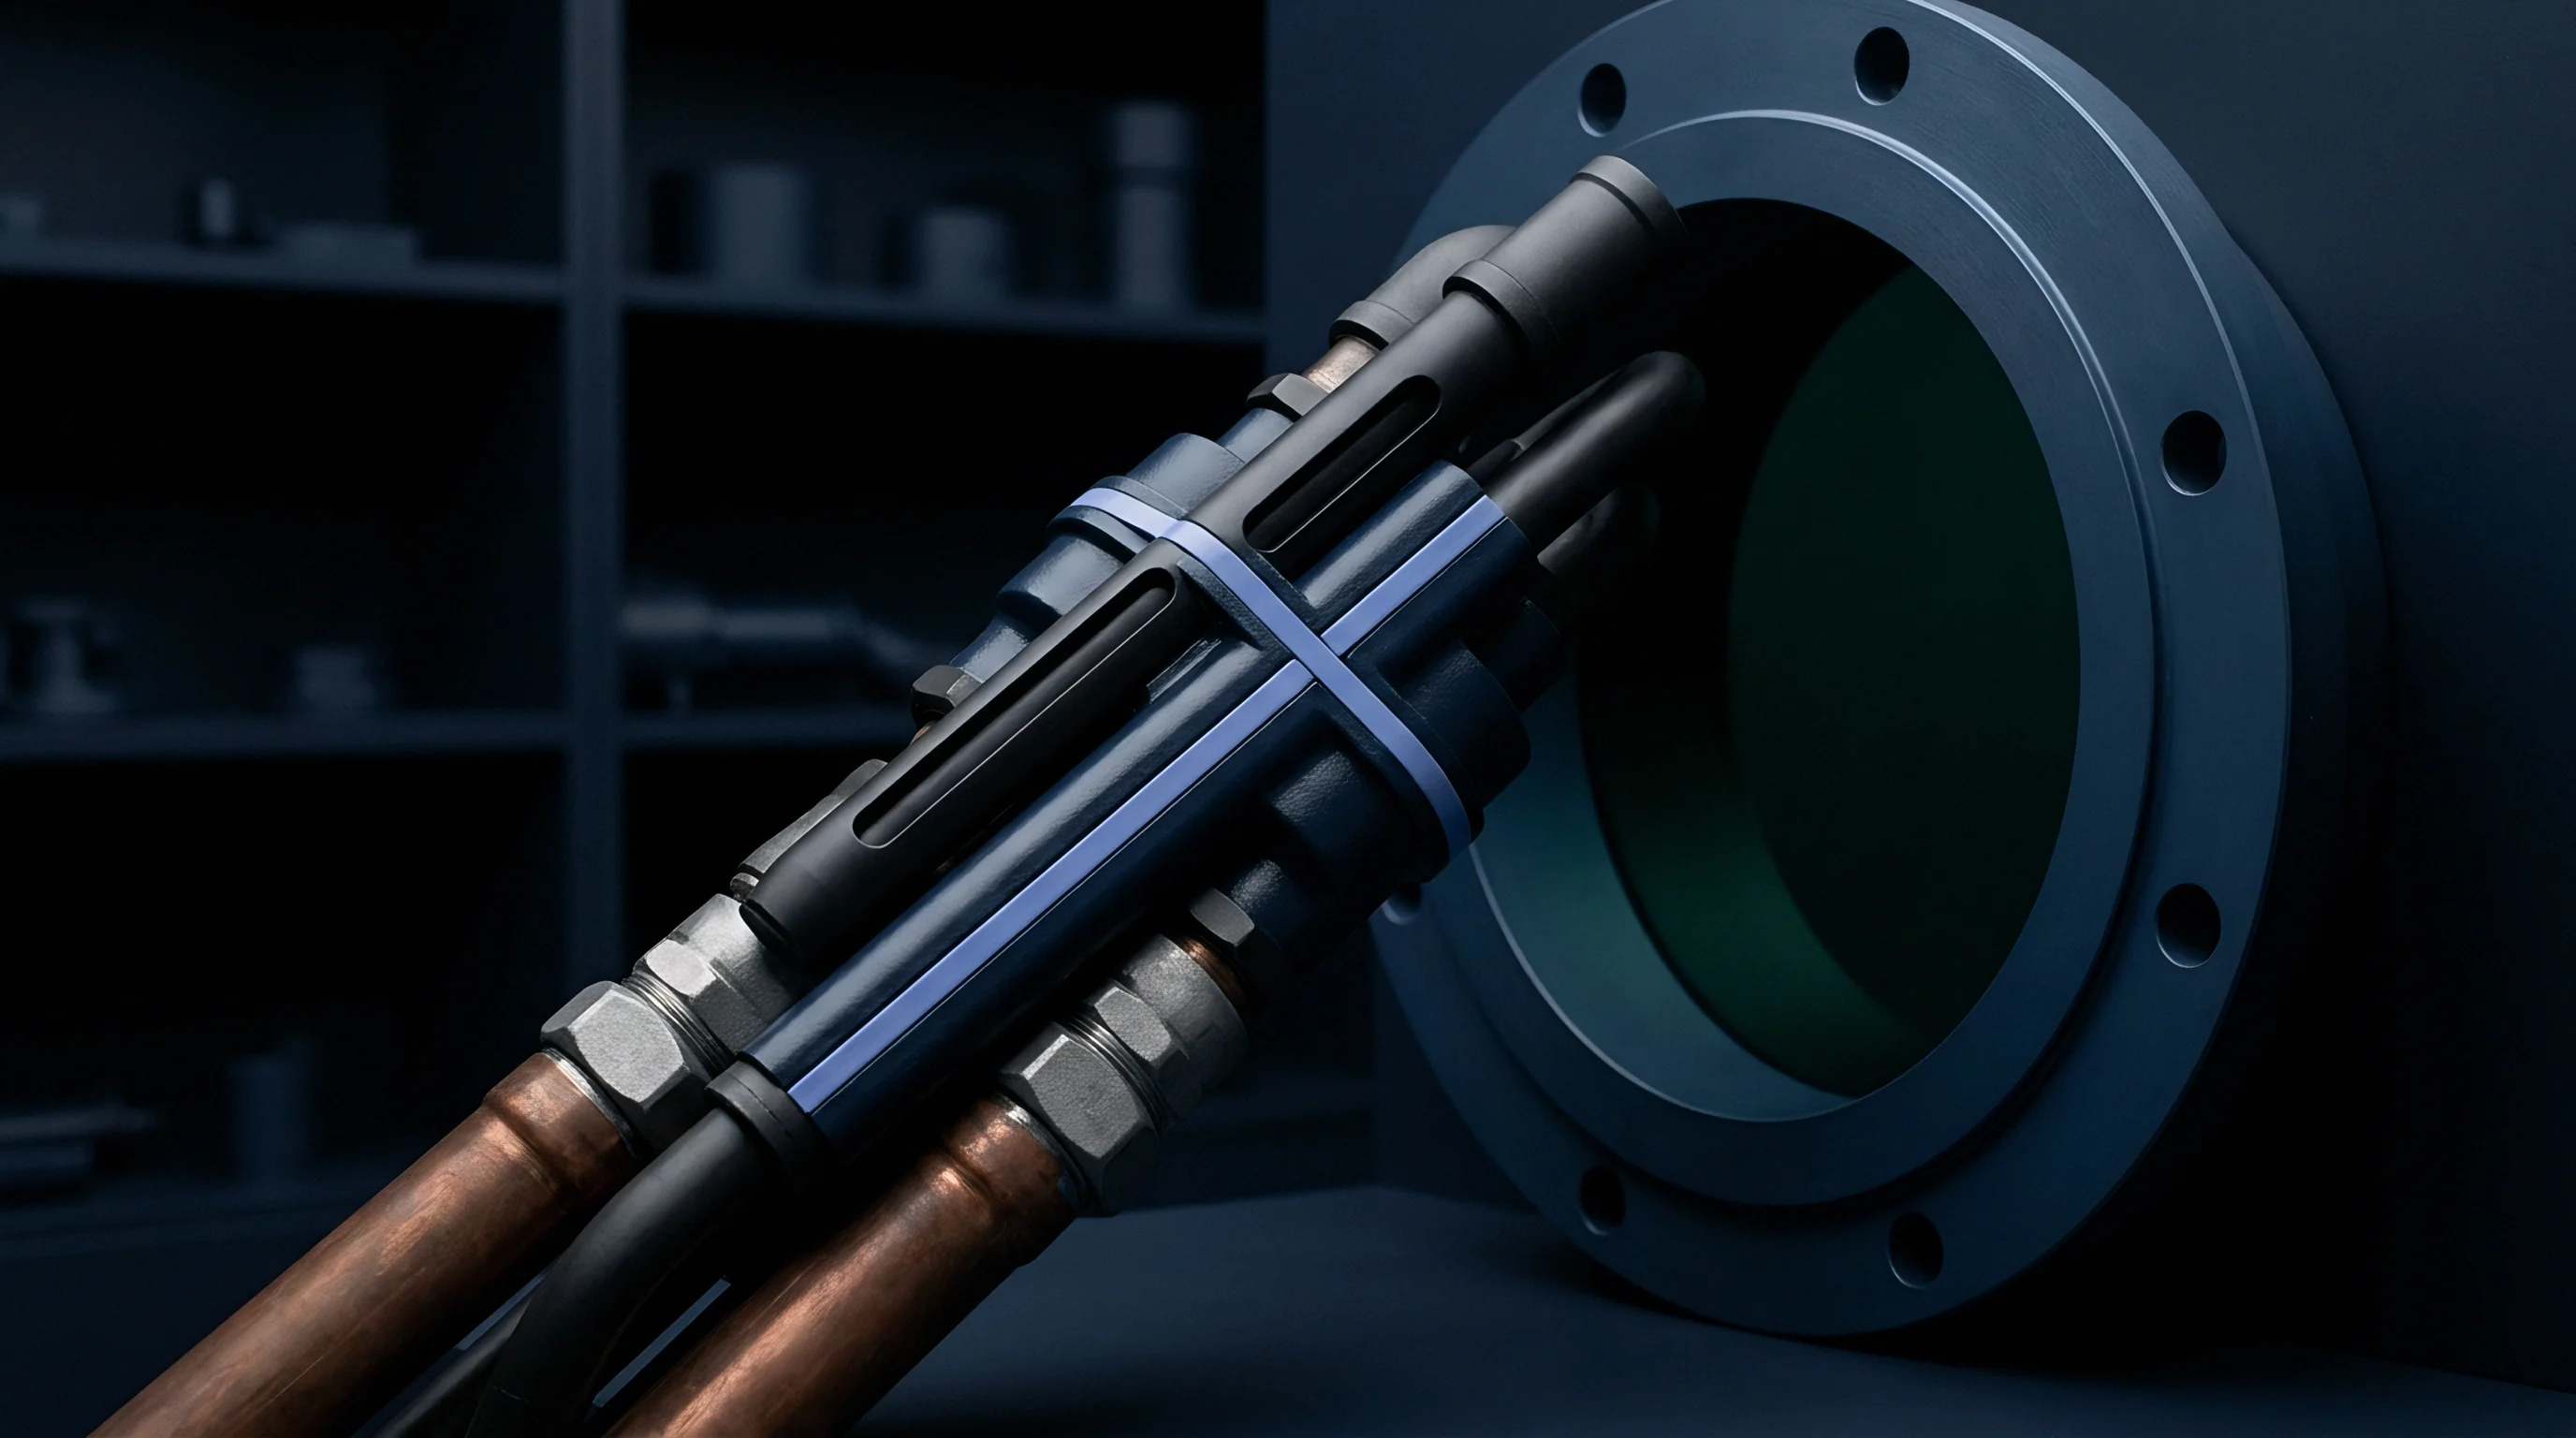
Buffer Capacities and Micro Stop Accumulation
Production facilities frequently misunderstand buffer capacity requirements. Installing an oversized buffer floor space increases work-in-progress inventory carrying charges and lengthens total manufacturing lead time from raw feed to boxed product. Conversely, undersized buffers leave the serialized equipment array completely defenseless against micro-stoppages.
Micro stops aggregate into shifts. An operator clearing a tape roll on a box former takes forty-five seconds; with a two-minute buffer, the main line never registers the pause.
Calculating necessary decouple volume depends directly on the mean time to repair of upstream equipment and the mean time between failures of downstream tooling. Factory acceptance trials isolate stations. Equipment suppliers routinely test individual machines under pristine conditions without line backpressure, recording ninety-nine percent uptime figures that vanish the moment the machine encounters irregular parts feeding on the plant floor.
The upstream manufacturer routinely asserts that their assembly unit achieved its warranted forty parts per minute during shop floor tests, attributing the subsequent twenty-four unit line average to the buyer’s uncoordinated indexing conveyor.


Clamp
Gripping fixtures and datum blocks dictate whether automated transfer arms place parts accurately or smash tooling into steel nests. At the physical junction between two vendor platforms, mechanical tolerances converge. Station A uses pneumatically actuated jaws to drop a cast housing onto a walking beam, while Station B uses an overhead Cartesian gantry to retrieve that housing.
If the casting sits three hundred microns outside the pickup window because of conveyor rail play, the gantry gripper crashes, shears its alignment pins, and drops the machine into an emergency stop state.
Flange tolerances dictate transfer speed. Physical interdependencies demand rigorous review of mechanical alignment tolerances, nest locating pin designs, and part datum transfer methodologies prior to signing final design specifications. A machine builder focusing solely on internal station kinematics often ignores how parts enter or exit the fixture nest.
Transfer mechanisms require clear mechanical handoff envelopes that account for product shrinkage, thermal expansion, and carrier wear over millions of continuous cycles.
Physical transfer rails, sensor handshakes, and pneumatic nest drop clearances generate more commissioning delay than individual station processing heads.

Mechanical Handshakes and Indexing Tolerances
Precision locating depends on standardized datums across the entire line. If the stamping die locates a stamped bracket from internal pilot holes while the subsequent laser cutting station clamps the same part using external sheared edges, progressive stamping die wear introduces immediate dimensional mismatch. The laser hits the wrong coordinate path despite executing its internal CNC code with absolute precision.
The tool cuts through solid metal, triggering an optical reflection alarm.
Dry runs reveal physical interference. Mechanical integration requires three-dimensional geometric modeling of the dynamic envelope swept by transfer arms, payload grippers, and moving nests. A gantry arm returning to home position can cross paths with an incoming pallet elevator if sensor timings slip by eighty milliseconds.
Physical interference destroys tooling, bends linear guide rails, and voids equipment warranties when lines are powered without coordinated interlock software validation.

Physical Interface Handoff Audits
Engineering teams verify interface boundary dimensions before releasing fabrication deposits. Auditing physical handoffs requires walking through every mechanical transfer point on the engineering drawings, establishing clear vendor responsibilities for each sensor bracket, guide rail adjustment screw, and safety tunnel interface. Clear boundaries eliminate floor disputes during site commissioning.
- Fixture Datum Alignment Verification requires engineering teams to review three-dimensional CAD master models to verify that all serialized machines clamp and locate the product from identical locating holes and edge features.
- Transfer Clearance Swept Volume Validation confirms that mechanical parts grippers, pneumatic ejector pins, and robotic end-effectors clear all structural machine frames, safety interlock curtains, and cable carriers during emergency stop trajectories.
- Conveyor Track Height and Level Harmonization establishes uniform pass-line heights across vendor boundaries within plus or minus 0.5 millimeters under full dynamic load conditions to prevent product binding during station transfers.
- Pneumatic and Vacuum Drop Zone Auditing verifies that part release mechanisms vent residual pressure instantly through quick-exhaust valves, preventing air backpressure from popping lightweight parts out of downstream locator nests.
- Wear Strip and Guide Rail Metallurgy Checking ensures conveyor wear tracks match product material hardness specs, preventing stainless steel brackets from chewing through soft aluminum transfer guides over extended run campaigns.
Rigid mechanical transfer rails amplify slight misalignments across sequential stations, while compliant intermediate transport carriers preserve dimensional tolerances across temperature swings.


Envelope
System boundary modeling reveals line constraints that spreadsheet balance models completely miss. A spreadsheet applies average cycle times and average availability figures across sequential stations, calculating an aggregated throughput that routinely overstates plant production by fifteen to thirty percent. Average numbers smooth away the catastrophic operational drag of overlapping stochastic failures.
If Station 1 drops offline for two minutes while Station 4 experiences a ninety-second tool pause, their compound effect on unbuffered line throughput depends entirely on when those pauses hit relative to buffer fill states.
Discrete event models prove capacity. Constructing a dynamic simulation of the proposed line layout prior to signing commercial contracts establishes the true operating envelope of the connected facility. The simulation model takes raw statistical distributions for mean time between failures, mean time to repair, tool wear cycles, and operator response latencies, running thousands of virtual shifts to reveal where parts accumulate and where stations starve.
Buffers damp upstream shock.
Buffering thirty minutes of work in progress between the primary press and downstream heat treating recovers eleven percent of lost line availability under two-hour mean time to repair regimes.

Should Simulation Model Line Degradation Directly?
Stochastic models expose hidden bottleneck migration. In a four-station medical assembly line, Station 2 may appear as the theoretical bottleneck based on a 4.5-second cycle time compared to 4.0 seconds on adjacent cells. Running a stochastic simulation with realistic parts feeder jam rates reveals that Station 1, despite running a 3.8-second cycle, suffers a two-minute bowl jam every four hundred cycles.
The feeder unreliability causes Station 2 to starve for seventeen percent of its scheduled shift, shifting the practical operational constraint upstream.
In municipal water systems, engineers design elevated reservoirs to decouple variable treatment plant pumping rates from chaotic domestic morning demand spikes. Industrial production networks mirror this exact fluid mechanic. Inserting decoupling accumulators between erratic primary forming assets and sensitive secondary finishing cells protects downstream capacity from upstream surge pressure.
The accumulator preserves station flow.

Stochastic Modeling of Machine Stoppages
A rigorous worked calculation illustrates the necessity of buffer sizing. Take an assembly line with five sequential stations running an assumed target rate of sixty units per minute (one part per second). Assume each station demonstrates an independent availability of ninety-six percent (0.96) based on vendor FAT test data.
Assume the mean time between failures across each station follows an exponential distribution averaging twelve hundred seconds (twenty minutes), with an average mean time to repair of fifty seconds.
In an uncoupled configuration with zero intermediate accumulation, total system availability equals 0.96 multiplied across five stations, resulting in 0.815 (81.5 percent overall line availability). The uncoupled line produces 2,934 units per hour instead of the theoretical 3,600 units. Adding a physical accumulator with a thirty-part capacity (thirty seconds of decoupling) between Station 2 and Station 3 isolates the line into two sub-systems.
The fifty-second mean time to repair on Station 1 or 2 now only starves Station 3 if the pause outlasts the buffer drain time.
| Configuration Scenario | Accumulator Units | Mean Availability (%) | Hourly Output (units) |
|---|---|---|---|
| Zero Decoupling (Serial) | 0 | 81.5 | 2,934 |
| Minimal Buffer (15s) | 15 | 84.8 | 3,052 |
| Balanced Decouple (45s) | 45 | 89.6 | 3,225 |
| Full Isolation (120s) | 120 | 93.8 | 3,376 |
| Infinite Capacity Ideal | 9,999 | 96.0 | 3,456 |
| Methods note: Calculations assume five automated stations with identical 1.0s cycle times, MTBF of 1,200s, and MTTR of 50s under Poisson arrival assumptions. | |||
Testing data from high-volume automotive component lines in 2022 indicates that a forty-five-second buffer recovers eight percent of lost throughput across five linked automated cells, based on sample runs exceeding two million cycles. What would move this figure is a shift in MTTR variance: if maintenance response times stretch from fifty seconds to four minutes due to lean staffing, the forty-five-second buffer drains completely during the initial phase of the stoppage, reducing recovered throughput to less than two percent. The desk cannot fully defend the assumption that operator intervention times remain under sixty seconds across night shifts.
Buyers facing uncertain maintenance staffing allocations must evaluate line capacity using conservative ninety-second response estimates rather than catalog values. Engineers continue to debate whether the financial return on high-capacity accumulation loops justifies floor space allocation when automated tool changers can cut recovery duration in half.


Exposure
Commercial risk divides sharply across equipment supplier boundaries. When a complete manufacturing line fails to hit guaranteed output targets during plant commissioning, individual machine builders systematically blame adjacent equipment. The press builder faults the feeder conveyor for erratic coil pitch feeding; the conveyor vendor points to fluctuating voltage from the plant drop; the vision inspection vendor claims the parts arrive covered in excessive lubricant spray from the press.
The buyer stands trapped in the center, paying carrying costs on uncompleted capital installations.
Multiple equipment purchase contracts require rigid interface control documents and unified acceptance protocols. Dividing a multimillion-dollar assembly line procurement across three or four separate original equipment manufacturers saves upfront machinery purchasing costs compared to single-source turnkey integration. Those savings evaporate within weeks if the contract terms fail to establish joint performance covenants and clear handshake protocols.
Vendors dispute shared downtime hours.
Contractual language establishing joint and several performance acceptance across all equipment vendors forces mechanical suppliers to resolve signal handshake latencies prior to final payment disbursements.
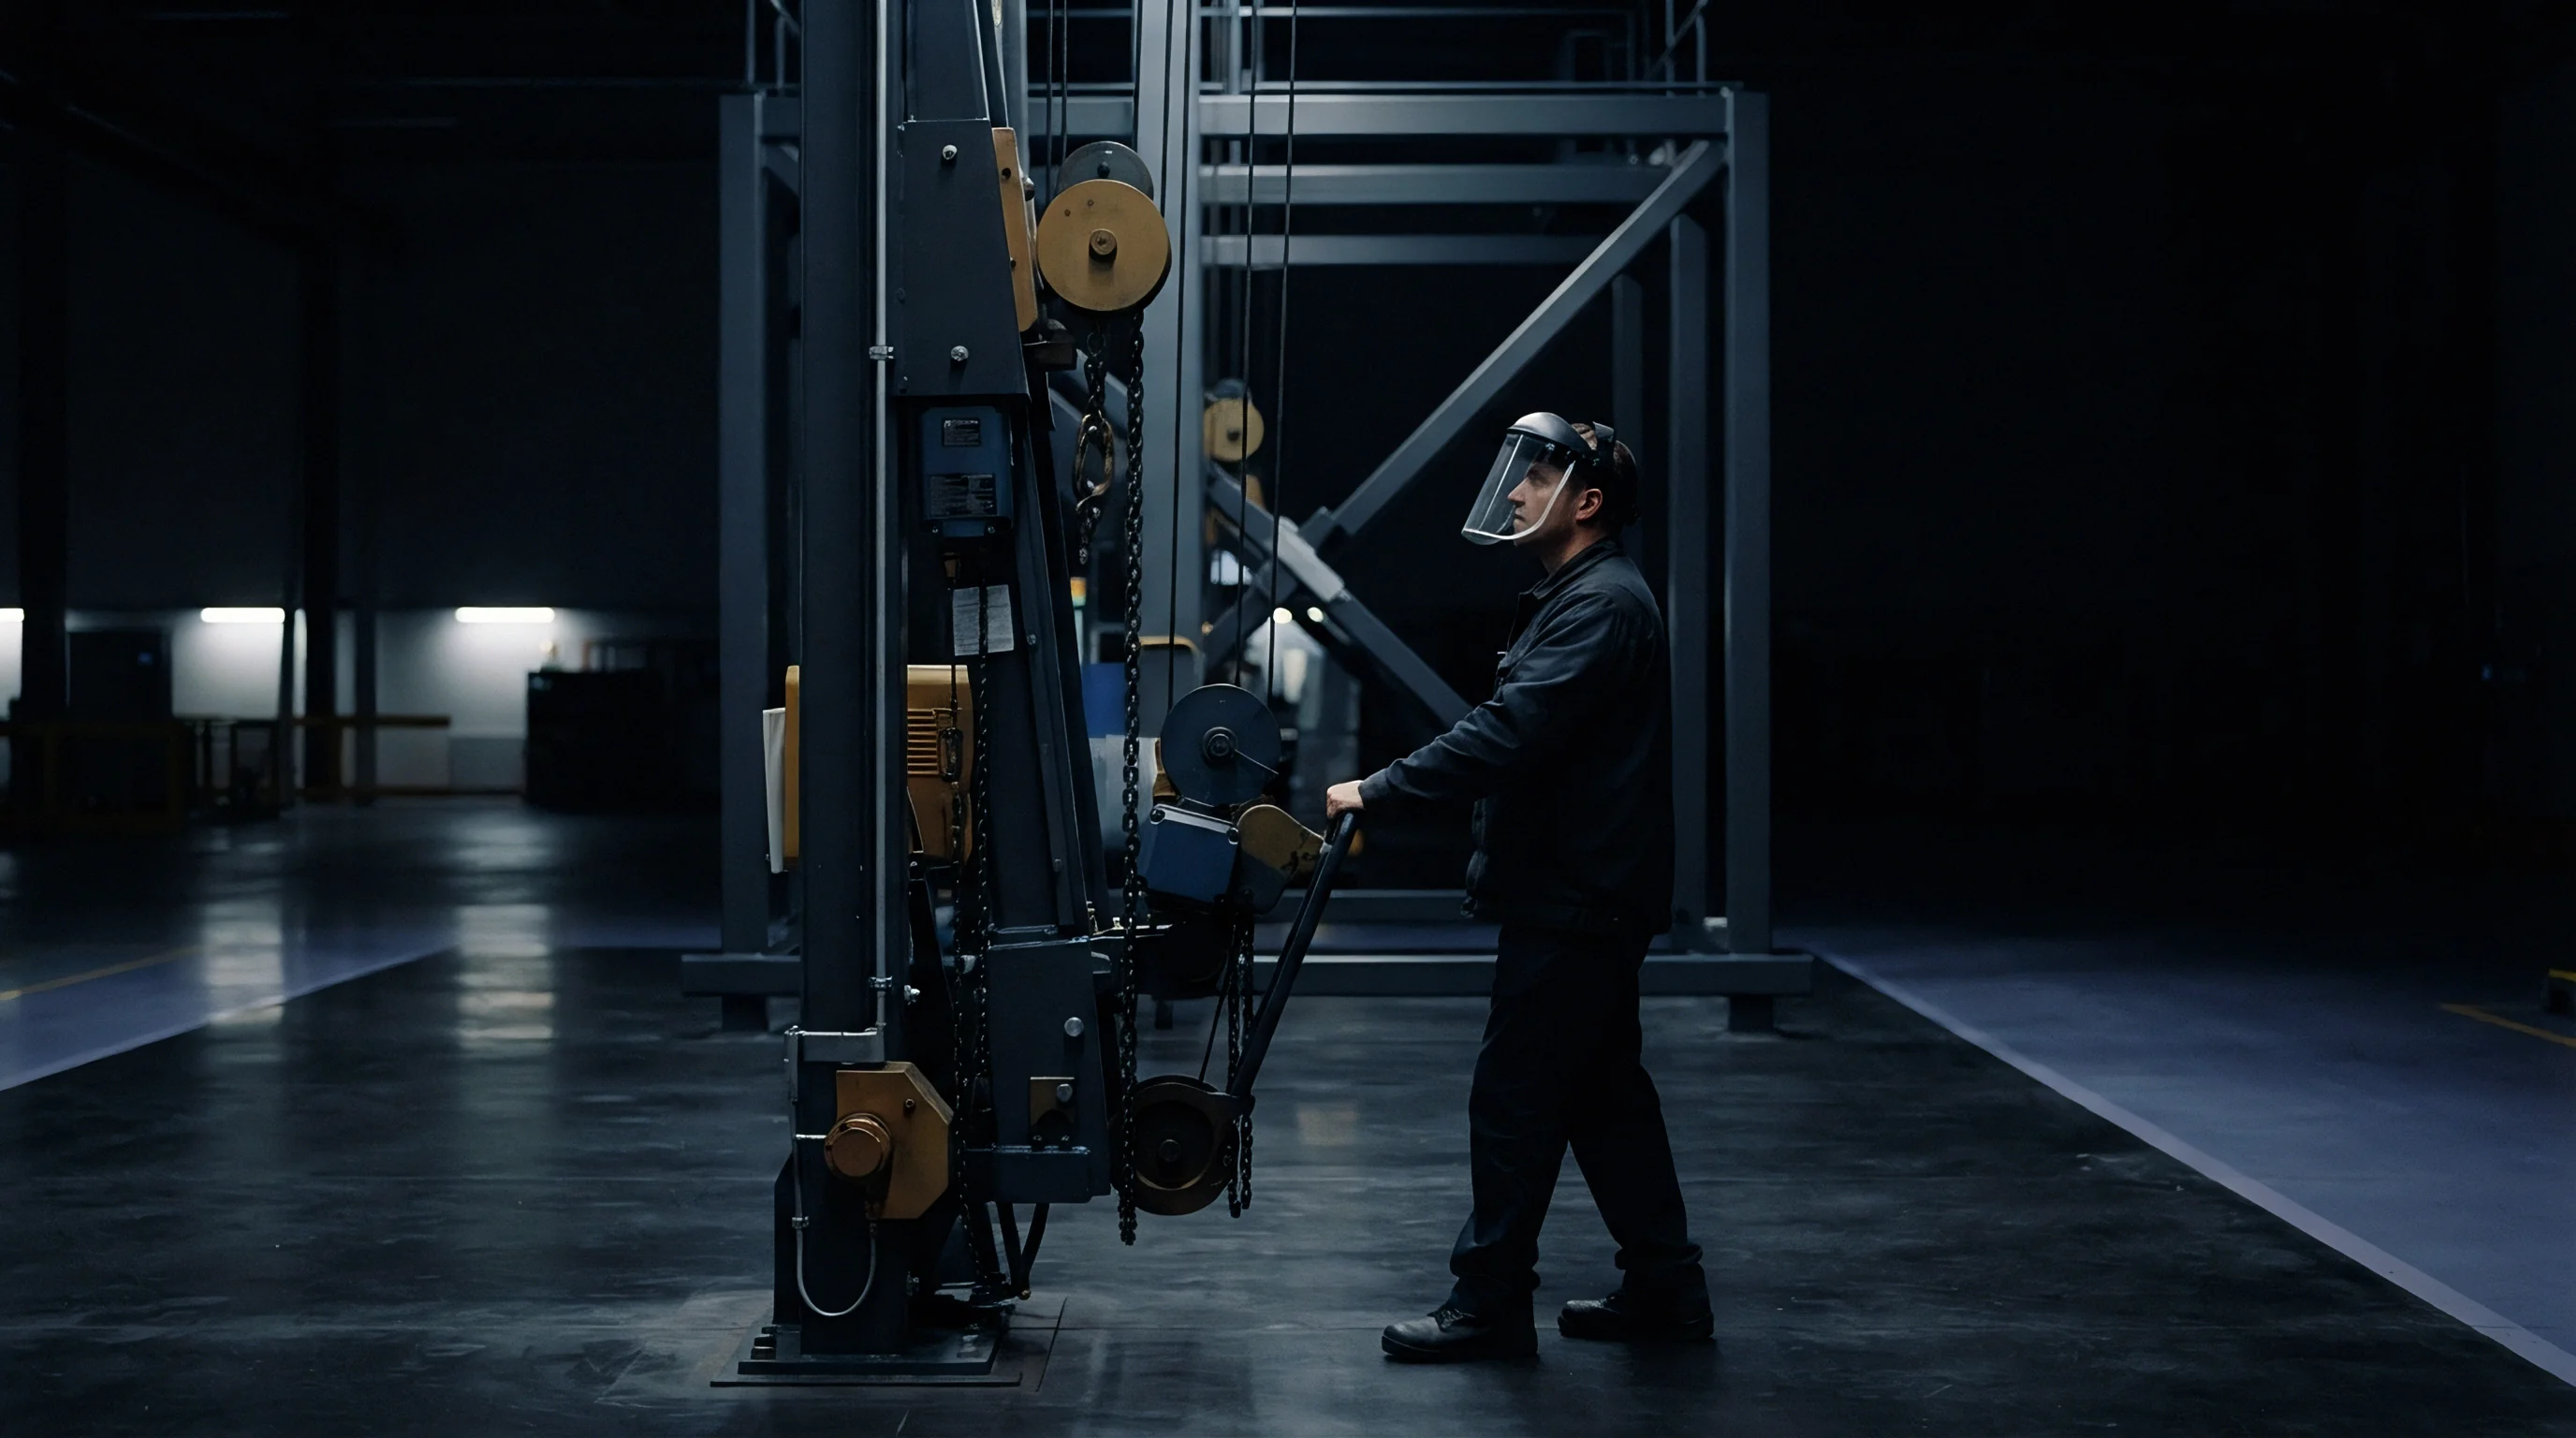
Why Does Turnkey Sourcing Fail Multiple Vendors?
Turnkey system integrators bundle markup fees ranging from twenty to thirty-five percent to shoulder complete line operational liability. Buying directly from individual machine builders eliminates that integration fee, shifting the coordination burden directly onto the buyer’s internal manufacturing engineering team. If internal engineering lacks the staff to oversee software interface protocols, mechanical transfer clearances, and line speed matching, the plant absorbs far greater financial losses in unrecovered downtime.
Vendor contracts executed in isolation contain dangerous warranty loopholes. Machine builders specify standard acceptance criteria based on twenty-minute dry-cycle runs in their own shops, isolated from upstream debris and downstream backpressure. When delivered to the customer site, their contractual warranty obligations trigger upon the individual machine achieving its standalone nameplate speed, regardless of whether that machine integrates cleanly with adjacent equipment.
The buyer signs off on isolated machines, releases equipment payments, and inherits an integrated line that fails to run at volume.
- Interface Control Document Execution locks all mechanical, electrical, pneumatic, and communication boundary parameters into binding contract exhibits signed by every participating vendor prior to down payment release.
- Standardized Programmable Logic Controller Tagging establishes unified data dictionaries, fault code structures, and interlocking handshakes across all equipment controls architectures to prevent software integration mismatches.
- Overall Line Operational Performance Guarantees bind at least fifteen percent of equipment contract value to the successful completion of an integrated continuous run test alongside upstream and downstream machinery.
- Liquidated Damages For Handshake Non-Compliance assign clear daily financial penalties to any vendor whose mechanical transfer hardware or control communication protocols delay connected line commissioning.

Interface Control Documentation and Milestone Gating
A rigorous Interface Control Document (ICD) establishes the precise physical and informational boundaries between independent equipment assets. The ICD specifies physical conveyor heights, roller centerlines, transfer nest dimensions, electrical cable drop locations, safety circuit emergency stop configurations, and Ethernet communication tag formats. Every vendor must sign the ICD prior to starting detailed mechanical fabrication.
Connecting acceptance milestones to line throughput performance secures buyer leverage throughout the commissioning cycle. Splitting equipment disbursements into thirty percent upon order, thirty percent upon successful standalone factory acceptance testing, twenty percent upon delivery, and twenty percent upon passing a seventy-two-hour integrated site performance run ensures supplier attention on floor handshakes. A contract clause stipulating that thirty percent of equipment payment milestones remain withheld until the complete multi-machine cell operates continuously for seventy-two consecutive hours at target yield forces competitive equipment suppliers to coordinate their controls architecture.


Clearance
Pre-execution diligence requires an uncompromising operational gate review. Once commercial signatures dry on equipment purchase agreements, altering conveyor paths, adding intermediate buffer towers, or restructuring programmable logic controller communication architectures incurs punitive change-order expenses. Equipment builders charge premium engineering rates to modify mechanical frames or rewrite safety interlock logic after steel cutting commences.
Gating the procurement process protects capital reserves.
Operational stage gates enforce discipline across engineering, procurement, and operations teams. A rigorous readiness evaluation tests whether mechanical drawings reflect true product dimension variations, whether buffer capacities protect the bottleneck asset from starvation, and whether contract documents hold vendors mutually accountable for connected line output. Skipping these diagnostic steps to meet an aggressive market launch date guarantees production delays during site commissioning.

Integrated Factory Acceptance Testing Gates
Standalone factory acceptance tests provide incomplete operational proof. Equipment vendors prefer running clean sample parts through their machines in twenty-minute bursts, measuring cycle speed under idealized conditions. Factory acceptance trials isolate stations.
A rigorous stage gate requires integrated testing where feasible, linking adjacent machines in the builder’s shop or connecting physical machines to dynamic hardware-in-the-loop simulation rigs that mimic downstream backpressure and upstream starvation signals.
Emulating field interface signals exposes control errors prior to crating and shipping machinery. Feeding simulated parts backpressure signals into a primary packaging cell verifies whether the machine decelerates smoothly or faults out abruptly with jammed product nests. Finding software bugs and mechanical timing flaws on the vendor’s build floor costs a fraction of the expense required to diagnose identical failures while burning factory payroll during full-scale commissioning.

Execution Stage Gates Prior to Commitment
A definitive decision gate sequence governs equipment procurement commitments. The evaluation begins with cycle time and buffer sizing calculations, progresses through three-dimensional CAD interface audits, and culminates in binding contract covenants that link vendor payments to integrated line throughput. Every technical interface receives an engineering signoff before commercial contracts receive financial authorization.
Engineering teams verify that nominal throughput claims account for operational realities, including scheduled tool changes, preventive maintenance windows, and micro-stoppages. Evaluating line interdependencies transforms equipment purchasing from an exercise in catalog shopping into a rigorous industrial engineering discipline. Buyers who enforce synchronized cycle-time allocations, simulate stochastic failure regimes, and mandate interface control specifications preserve their capital reserves and secure planned unit economics on the plant floor.