Dynamic Coolant and Pneumatic Header Pressure Drop Audit Verification Methods
Dynamic header audits verify pressure stability by measuring high-frequency transient drops during concurrent machine cycling rather than relying on static baselines.


Supply
Chilled fluid loops and compressed gas mains behave predictably during continuous steady states, yet they break during concurrent machinery cycles. When six automated stamping cells strike or eight machining spindles engage simultaneously, distribution manifolds encounter instantaneous volume spikes that standard mechanical dials fail to register. A distribution ring displaying 6.2 bar during idle shift changes often collapses to 3.8 bar for two hundred milliseconds during synchronous tool actuation.
That transient deficit trips safety interlocks, stalls pneumatically indexed transfer tables, and starves spindle cooling passages. Capital expenditure teams routinely misdiagnose these stoppages as vendor equipment defects rather than distribution geometry starvation.
Auditing factory delivery lines begins at the interface between primary mechanical plant equipment and the branch mains feeding production bays. The primary header diameter determines both bulk fluid velocity and the line capacitance available to absorb rapid valve actuations. Fluid mechanics in coolant loops dictate that pressure drop varies with the square of flow velocity, scaled by pipe friction and equivalent fitting lengths.
Compressed air headers exhibit additional complexity due to gas compressibility, thermal contraction across pressure-reducing valves, and transient sonic chokes at undersized fittings. Auditors evaluate the pressure gradient across the entire header run rather than relying on point measurements taken at receiver tank discharges.
Piping layout geometry governs dynamic system capacity far more reliably than aggregate pump displacement or receiver volume.
Friction losses compound when fluid velocity exceeds recommended velocity ceilings in distribution pipework. For closed-loop coolant circuits, maintaining fluid velocity below 2.1 meters per second suppresses pipe erosion and limits parasitic pumping losses. For industrial pneumatic headers operating at 6 to 8 bar gauge, audit guidelines hold gas velocities below 6.0 meters per second in main loops and 9.0 meters per second in localized drop legs.
When production expansion programs connect additional process equipment to existing main lines, velocity surges push friction values beyond design boundaries. The resulting pressure drop starves the furthest production drop legs first, creating localized machine faults that appear intermittent in shift maintenance logs.
Pneumatic header loops resist transient decay when designed as continuous closed rings rather than dead-ended branch networks. Closed-loop headers deliver pressurized gas from two directions simultaneously, cutting effective transit distance and halving localized flow velocity across the distribution pipe. Coolant headers require reverse-return configurations to balance differential pressure across parallel heat exchangers without relying excessively on manual balancing valves.
Without balanced hydronic layout, the closest thermal load monopolizes delivery flow, starving downstream process equipment during peak production runs.
Auditors establish line integrity by evaluating pipe roughness, valve flow coefficients, and internal diameter transitions. Threaded black iron and galvanized steel pipes collect internal scale, increasing friction coefficients by thirty percent over five years of active production life. Modern smooth-bore aluminum and welded stainless steel distributions maintain stable friction factors, preserving dynamic flow headroom as operating years accumulate.
Every mechanical tee, unvalved elbow, and diameter reducer adds equivalent pipe length to the distribution resistance calculation. The audit dossier tabulates these equivalent lengths to confirm whether physical pipe friction accounts for observed distribution line losses.
A broad header line compensates for poor downstream piping layout until every machine cell actuates at once.


Tap
Branch takeoff points connect primary distribution headers to machine floor drops through isolation valves, coalescing filters, and intermediate regulators. Takeoff drops installed along the top quadrant of compressed air headers prevent pipe condensate from migrating into tooling solenoids. For industrial coolant systems, takeoffs penetrate the horizontal center line of the main distribution pipe to avoid bottom sediment accumulation and entrained top gas pockets.
Dynamic pressure losses at the takeoff fitting represent the primary contributor to unexpected equipment starvation during machine cycle ramp.

Manifold Branch Sizing and Fitting Restriction
Line connections sized identical to machine inlet ports produce severe flow constriction during in-cycle actuations. When a pneumatic cylinder with a half-inch inlet port connects directly to a thirty-meter half-inch drop line, localized air velocity spikes above twenty meters per second during stroke initiation. That velocity spike induces instantaneous frictional pressure decay that starves the actuator pilot valves.
Auditors examine takeoff geometry to verify that drop lines maintain at least one standard nominal pipe size above equipment connection ports before stepping down at the point of consumption.
Quick-disconnect pneumatic couplers and miniature ball valves introduce severe internal orifice bottlenecks. A standard half-inch industrial interchange coupler carries an internal throat diameter of only 7.2 millimeters, slashing effective flow coefficient values. Coolant line quick-release couplings with internal check valves restrict fluid passages, generating localized cavitation and pressure losses exceeding 1.2 bar under nominal pump discharge.
Auditors record fitting pressure drops directly across takeoff assemblies under full-cycle production demand to identify mechanical bottlenecks.
- Transient flow starvation occurs when multiple pneumatic cylinders fire simultaneously, collapsing localized manifold pressure below pilot valve shift thresholds within forty milliseconds.
- Localized coolant cavitation develops across undersized manifold isolation valves, creating micro-bubble collapse that erodes pump impellers and generates flow chatter.
- Regulator flow droop manifests when high downstream consumption pulls pilot diaphragm valves open, depressing secondary delivery pressure below required machine operating setpoints.
- Accumulated line moisture enters pneumatic drop legs during high-velocity air rushes, overwhelming particulate filters and causing solenoid spool hesitation.

Transient Pressure Decay during Simultaneous Firing
Tooling clusters operating on synchronized control clocks generate additive pressure shockwaves along distribution drop legs. In automated assembly lines, robotic end-effectors, clamping pistons, and part ejectors draw utility volume within identical hundred-millisecond windows. This concurrent draw evacuates localized header volume before upstream pipe flow accelerates to replenish the drop.
The audit measures the duration and depth of this pressure trough to verify whether machine reliability margins remain protected.
Coolant circuits face thermal-shock flow transients when multi-spindle machining centers cycle coolant solenoids between cutting operations. Rapid valve closures generate hydraulic water hammer spikes reaching four times system design pressure, followed by rarefaction waves that cause pressure to drop below fluid vapor pressure. These transient troughs produce dissolved gas release, creating air pockets that insulate tool cutting edges and accelerate tool wear.
Dampening these hydraulic transients requires tuned bladder accumulators installed immediately upstream of fast-acting solenoid valves.
Plant managers often claim their line filters are clean because maintenance swapped the filter cartridges only two weeks ago.

Instrumentation
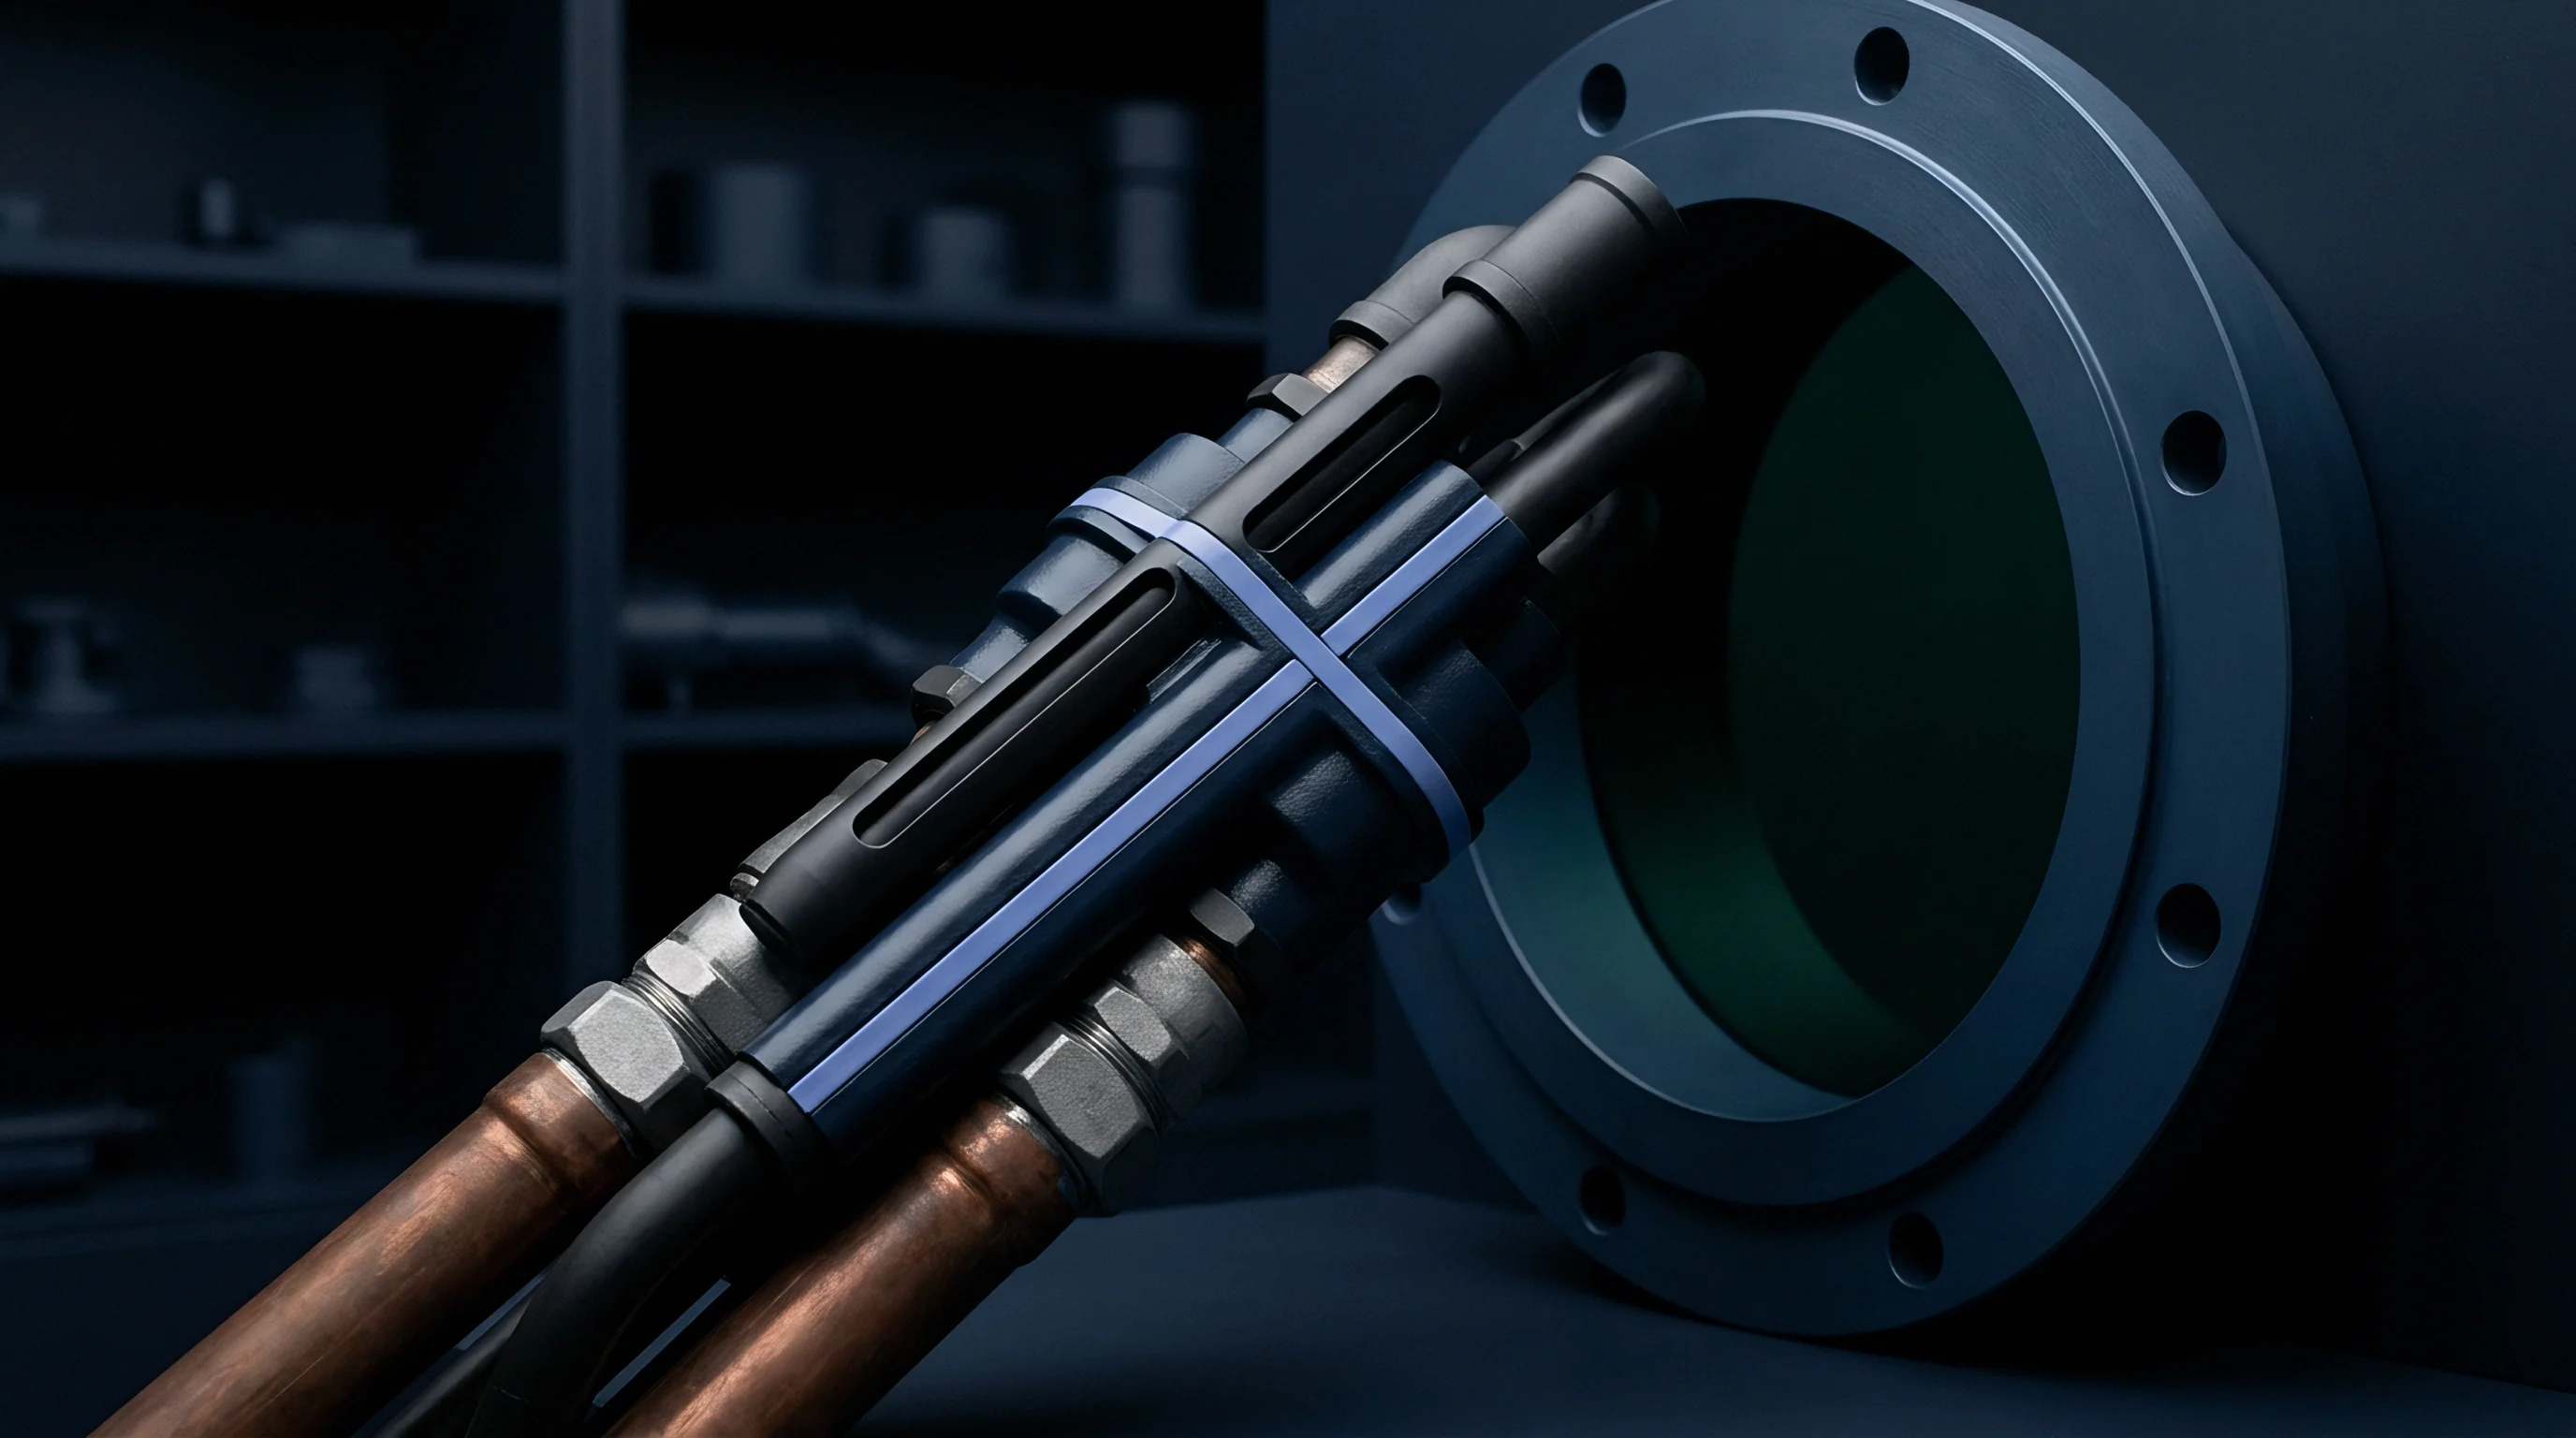
Auditing transient distribution line phenomena demands electronic measurement hardware capable of logging transient fluctuations far beyond the capability of analog bourbon gauges. Standard mechanical pressure gauges incorporate internal liquid glycerin dampening to prevent needle flutter, concealing sixty-cycle-per-minute pressure drops from maintenance personnel. Dynamic verification relies on high-speed piezoresistive pressure transducers installed directly in fluid streams via minimal-length test ports.
These digital sensors capture pressure transients occurring within sub-millisecond durations, revealing line instability that remains invisible during steady-state inspection walks.

High Speed Data Acquisition Hardware Setup
Electronic sensor placement determines the diagnostic fidelity of distribution line pressure audits. Transducers mounted on extended flexible tubing suffer from fluid column inertia, attenuating high-frequency pressure peaks and distorting recorded wavefronts. Test engineers couple piezoresistive transmitters directly to distribution headers using rigid stainless steel minipess test fittings positioned perpendicular to fluid flow.
Signal acquisition modules record analog current or voltage signals at sample rates of one kilohertz or higher, preserving transient waveforms for fast Fourier transform evaluation.
Pneumatic audit lines also incorporate digital thermal mass flow meters positioned upstream and downstream of major distribution headers. Thermal mass meters measure gas mass flow rates independently of line temperature and pressure fluctuations, updating output channels at response times below ten milliseconds. For coolant headers, ultrasonic transit-time flow meters clamped to external pipe walls measure volumetric flow rates without inducing parasitic flow resistance or interrupting continuous factory operations.
| Measurement Target | Sensor Technology | Sampling Rate | Accuracy Class | Audit Verification Limit |
|---|---|---|---|---|
| Transient pneumatic decay | Piezoresistive silicon | 2000 Hz | ±0.10% full scale | ΔP > 0.35 bar across 50 ms |
| Coolant hydraulic hammer | Piezoelectric quartz | 5000 Hz | ±0.25% full scale | Peak surge > 1.8x line rating |
| Header bulk flow velocity | Ultrasonic transit-time | 100 Hz | ±0.50% of reading | Fluid velocity > 2.1 m/s |
| Pneumatic mass consumption | Thermal mass inline | 500 Hz | ±1.00% of reading | Header draw > 120% receiver rate |
| Secondary regulator droop | Differential strain gauge | 1000 Hz | ±0.15% full scale | Droop > 12% below setpoint |
| Methods note: Logging hardware runs through 24-bit analog-to-digital converters with isolated power conditioners to reject inverter drive electrical interference. | ||||
What Triggers High Frequency Sensor Aliasing?
Digital acquisition modules configure low-pass anti-aliasing filters to prevent high-frequency hydraulic noise from corrupting transient diagnostic records. When fluid pumps with multi-vane impellers operate at 3600 RPM, they generate mechanical blade-pass pressure ripples exceeding three hundred hertz. If an acquisition system logs data at five hundred hertz without appropriate hardware analog filtering, these blade-pass oscillations fold into lower frequency bands.
The resulting data plots display phantom low-frequency pressure oscillations that do not exist within the physical piping loop.
Filtering algorithms must balance signal smoothing against the transient response speed necessary to identify line starvation. Setting digital averaging filters too aggressively flattens true millisecond-scale starvation troughs, transforming a catastrophic four-bar drop into an innocuous half-bar ripple on summary dashboards. Audit personnel verify raw, unfiltered sensor data streams alongside processed curves to validate that signal filtering does not mask equipment operational risks.
Piezoresistive sensors logged at two kilohertz reveal pneumatic pressure collapse that remains completely concealed on standard thirty-hertz supervisory screens.
Synchronization across distributed audit sensor nodes requires precise hardware clock synchronization or unified multi-channel acquisition chassis. Transducers recording upstream header discharge, mid-line manifold pressure, and remote machine point-of-use drops must log data points against a synchronized microsecond time stamp. Without unified time synchronization, auditors cannot track the physical propagation velocity of pressure waves moving through the factory distribution network, leaving root-cause attribution open to dispute.
What remains unresolved across complex factory headers is whether high-frequency pressure oscillations observed during multi-axis tool stops reflect true line starvation or localized fluid column resonance within dead-ended pipe runs.


Threshold
Auditors establish quantitative acceptance boundaries by comparing dynamic pressure curves against machine operational tolerance specifications. Equipment builders publish static operating pressure envelopes, such as 6.0 bar minimum pneumatic supply or 3.0 bar coolant delivery. These static ratings fail to specify how many milliseconds of sub-threshold pressure a machine control system tolerates before triggering a fault.
An audit establishes pass or fail status by quantifying both the depth and duration of pressure transients under worst-case concurrent production loading.
Dynamic Pressure Drop Audit Calculation
Evaluating header capacity requires calculating simultaneous flow consumption and checking cumulative pressure drop across primary mains, branch lines, and point-of-use drops. Consider an industrial machining hall supplied by a closed-loop pneumatic header running two hundred meters of DN80 smooth-bore aluminum pipe at 7.0 bar gauge base pressure. The hall contains sixty identical CNC machining centers, each consuming 0.025 normal cubic meters per second during tool changes, with a continuous base purge consumption of 0.005 normal cubic meters per second per machine.
Base continuous consumption across all sixty machines equals 0.30 normal cubic meters per second. During peak production shifts, empirical cycle analysis indicates that up to eighteen machines execute simultaneous tool changes within a shared 1.5-second time window. Peak instantaneous demand surges to 0.66 normal cubic meters per second.
The audit calculates dynamic pressure drop along the DN80 header ring under this transient demand peak:
Gas velocity in the DN80 ring (80 mm internal diameter, 0.005026 square meter cross section) under 7.0 bar gauge (8.0 bar absolute) operating pressure is evaluated at peak transient flow. Under 0.66 normal cubic meters per second, the actual compressed gas volume equals 0.0825 cubic meters per second. Because the closed-loop ring splits the flow in two directions, each half of the ring carries 0.04125 cubic meters per second.
Flow velocity equals 8.21 meters per second, which exceeds the conservative 6.0 meter-per-second audit benchmark for pneumatic distribution headers.
Frictional pressure drop calculated via the Darcy-Weisbach equation for compressed air reveals a total line loss of 0.42 bar along the primary ring. However, when combined with drop leg losses through standard DN25 lines and point-of-use coalescing filters (0.55 bar drop) and secondary regulators (0.48 bar drop droop), total pressure loss at the machine inlet reaches 1.45 bar. Machine inlet pressure collapses to 5.55 bar gauge during simultaneous tool changes, breaking the 6.0 bar minimum manufacturer operating specification and triggering spindle interlock faults.
| Header Zone | Static Baseline | Peak Transient Flow | Dynamic Pressure | Net Pressure Drop | Compliance Status |
|---|---|---|---|---|---|
| Compressor Room Discharge | 7.25 bar | 0.66 Nm³/s | 7.20 bar | 0.05 bar | Compliant |
| Zone 1 Primary Ring Tap | 7.18 bar | 0.54 Nm³/s | 6.95 bar | 0.23 bar | Compliant |
| Zone 2 Intermediate Ring | 7.12 bar | 0.48 Nm³/s | 6.70 bar | 0.42 bar | Warning Margin |
| Zone 3 Far-End Ring Apex | 7.08 bar | 0.42 Nm³/s | 6.62 bar | 0.46 bar | Warning Margin |
| Zone 3 Drop Leg Manifold | 7.02 bar | 0.18 Nm³/s | 6.05 bar | 0.97 bar | Non-Compliant |
| Zone 3 Machine Tool Inlet | 6.95 bar | 0.03 Nm³/s | 5.50 bar | 1.45 bar | Failed Audit |

Do Line Regulators Mask Header Pressure Decay?
Downstream pressure regulators installed at machine service units often obscure serious distribution pipe starvation during routine monitoring. Maintenance technicians adjust secondary regulators to 5.5 bar while the primary header reads 7.0 bar, assuming a 1.5 bar differential provides adequate operational buffer. When primary line pressure collapses from 7.0 bar to 5.6 bar during factory cycle spikes, secondary delivery pressure appears stable on mechanical dials because the regulator remains partially satisfied.
However, internal regulator flow area opens fully to compensate, exhausting its regulating authority and causing secondary pressure to plunge without warning during the next incremental volume surge.
Executing an audit verification program follows an exact procedural sequence to capture dynamic constraints under operating conditions:
- Mount high-frequency piezoresistive transducers at primary receiver discharge, header ring splits, remote drop manifolds, and point-of-use machine regulators.
- Establish baseline steady-state static pressure records across all logging nodes during full shift shutdown to confirm sensor zero-calibration and background line leak rates.
- Engage production machinery in controlled clusters, stepping from single-cell operations up to ninety percent scheduled factory capacity while recording real-time pressure profiles.
- Trigger synchronized cycle spikes by coordinating the simultaneous actuation of all pneumatic tools and coolant flushing solenoids across the audit zone.
- Correlate recorded pressure troughs against machine controller fault logs to pinpoint exact starvation thresholds and line decay durations.
- Calculate net line impedance and flow coefficients across every piping segment to identify physical pipe, valve, and fitting constraints.
Tolerating dynamic pressure drops below machine operating thresholds produces unpredictable cycle stalls, damaged cutting tooling, and ruined parts that cost operations directors tens of thousands of dollars in unrecovered scrap each operating quarter.


Remedy
Correcting dynamic distribution line deficits involves targeted mechanical improvements rather than blind compressor or pump up-sizing. Adding compressor horsepower or high-flow coolant pumps to an undersized piping distribution network increases energy bills while leaving dynamic line starvation unresolved. Flow starvation during transient machine actuation stems from localized line impedance and inadequate local capacitance.
Effective remedies establish distributed storage reserves and reduce fluid flow velocities across the delivery network.
Localized Receiver Placement and Dynamic Buffering
Pneumatic distribution lines benefit from dedicated secondary receiver tanks installed adjacent to high-demand machine clusters. Positioning a five-hundred-liter receiver vessel directly upstream of an automated stamping cell acts as a pneumatic capacitor. When tooling actuators fire, the localized receiver supplies the instantaneous volume rush, preventing line starvation in the primary header ring.
The primary header replenishes the secondary receiver across the remaining machine dwell cycle at a controlled, low-velocity flow rate.
Coolant distribution systems resolve transient starvation through hydraulic bladder accumulators and variable-frequency distribution pumps paired with fast-response pressure transducers. Bladder accumulators absorb hydraulic shockwaves created by closing solenoid valves while instantly discharging stored coolant volume when high-pressure spindles engage. Sizing accumulators to match the volume displacement of concurrent spindle valve cycles suppresses transient line pressure decay, keeping coolant delivery pressures within tight tolerances across every operational shift.
Section 7.4 of ISO 8573 specifies that compressed gas audit compliance requires verifying dynamic delivery pressures under peak production flow rather than resting static line charge.
Piping re-engineering programs prioritize looping dead-ended line runs and eliminating restrictive fitting assemblies. Replacing standard ninety-degree pipe elbows with long-radius sweeps reduces equivalent pipe length by fifty percent per turn. Upgrading point-of-use drop lines from twenty-five-millimeter tubing to forty-millimeter smooth-bore aluminum pipe drops localized flow resistance by a factor of four.
These geometric upgrades restore dynamic pressure headroom, securing scalable utility infrastructure that accommodates planned machinery expansions without operational disruptions.
Under formal engineering procurement contracts, utility handover clauses stipulate that contractor acceptance remains withheld until dynamic pressure drop testing verifies line stability under maximum concurrent factory loading.