Calculating True Production Line Bottlenecks before Signing Equipment Orders
Calculating production bottlenecks before signing equipment orders requires measuring true station sub-cycle times and intake variance against floor logs.
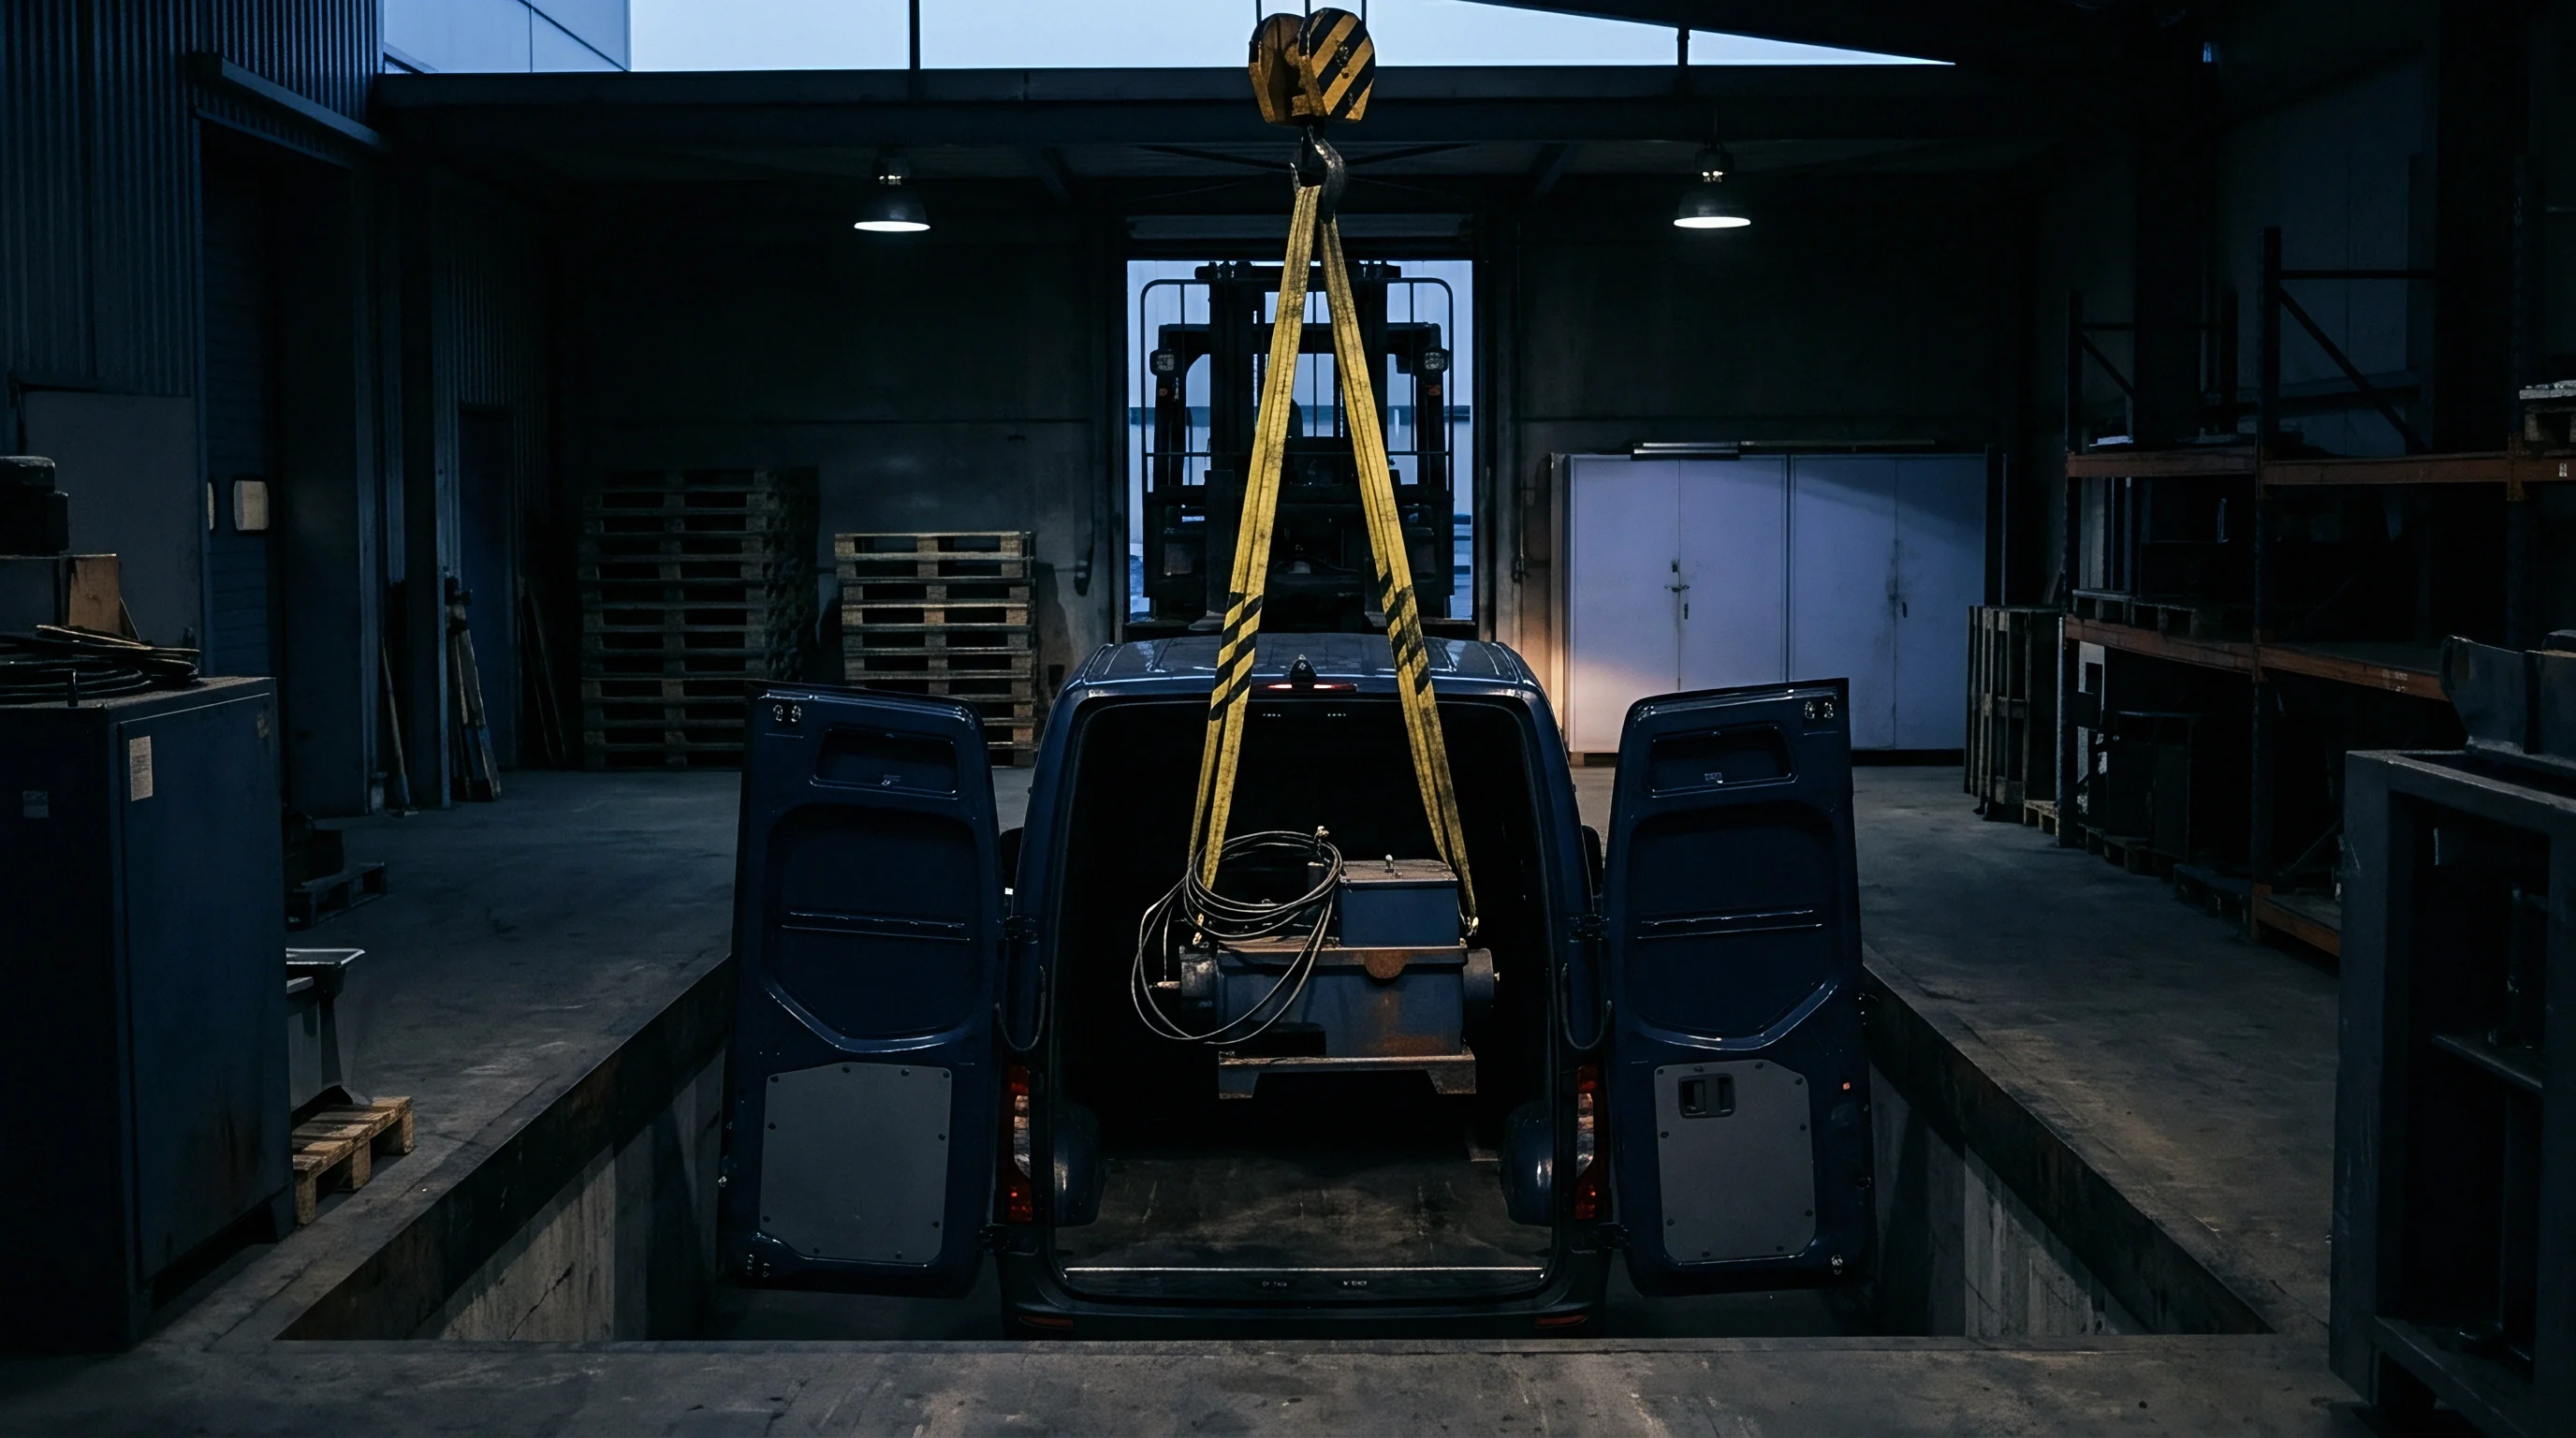

Dock
A facility’s maximum physical throughput is set at the receiving bays long before material ever reaches a primary processing station. Operations teams often treat intake like an infinite sink, assuming raw stock, bulk reagents, or unformed packaging arrive in a continuous stream that matches design assumptions. In reality, supply networks deliver goods in erratic pulses shaped by freight schedules, driver availability, vendor palletization errors, and dock gate traffic.
As delivery rates swing, the intake buffer bounces between starvation and total gridlock. That volatility leaves secondary stations running below speed while waiting for cleared stock, or forces workers to stage unverified inventory in the aisles, clogging main transport routes.
Finding true line capacity means evaluating the intake boundary at peak arrival stress, not on daily averages. A plant rated for forty thousand units a day across three shifts often misses its target simply because thirty percent of its raw inventory shows up in a single two-hour freight window. That surge overwhelms the yard, the inspection area, and the unpack stations all at once.
Buyers regularly spend capital upgrading downstream processing equipment to fix output shortfalls, only to find the bottleneck never moved from the unloading bay, where forklifts can’t clear pallets fast enough to keep the hoppers full.
ISO 22400 metrics confirm that line starvation under ten minutes per shift drops total equipment effectiveness by up to eight percent across automated packaging runs.
Queue growth reveals the real limit. Pinpointing the intake bottleneck takes a time-motion log covering every step from truck arrival to first-stage line entry. The core metric is the arrival distribution curve mapped against the line’s feed rate.
Whenever peak arrival outpaces staging clearance, inventory piles up instantly. That queue eats into floor space reserved for moving work-in-progress, forcing operators to push transport carts down secondary aisles and adding transit time to every station upstream.

Infeed Variance and Batch Incoherence
Mismatches between supplier packaging and machine feeder specs are a major, uncalculated cause of line starvation. Vendors benchmark line speeds using uniform, flawless materials in neat carrier trays. Real plants deal with varying pallet formats, non-standard film gauges, and corrugated boxes with unpredictable burst strength.
Unpacking, inspecting, and re-orienting these batches takes manual labor that vendor capacity models never account for.
Verification checks at the gate cause unpredictable holds. If a raw material lot arrives missing its certificate of analysis, QA quarantines the entire shipment. On a line running lean, that single hold cuts off material to primary equipment within hours.
Buyers who evaluate machinery without considering these inspection cycles base their throughput calculations on idealized conditions that collapse in daily practice.

Measuring Upstream Arrival Distributions
Isolating an intake bottleneck requires tracking raw material lot releases against downstream inventory levels over ninety consecutive operational days. That means logging four specific intervals on every shift: unloading dwell time, inspection duration, buffer transfer time, and hopper loading cycle length. Building a dynamic model from those time logs reveals whether starvation comes from vendor delivery schedules or mechanical limits at the intake dock.
Tracking delivery intervals to isolate intake constraints shows that dock gate delays caused sixty-two percent of downstream filler starvation, whereas filler mechanical failures accounted for less than fourteen percent of total downtime. Replacing the filler without expanding the intake staging area yields zero gain in daily output.
Machine capacity ratings standardly assume continuous, uniform raw material fed directly into the hopper without staging delays.

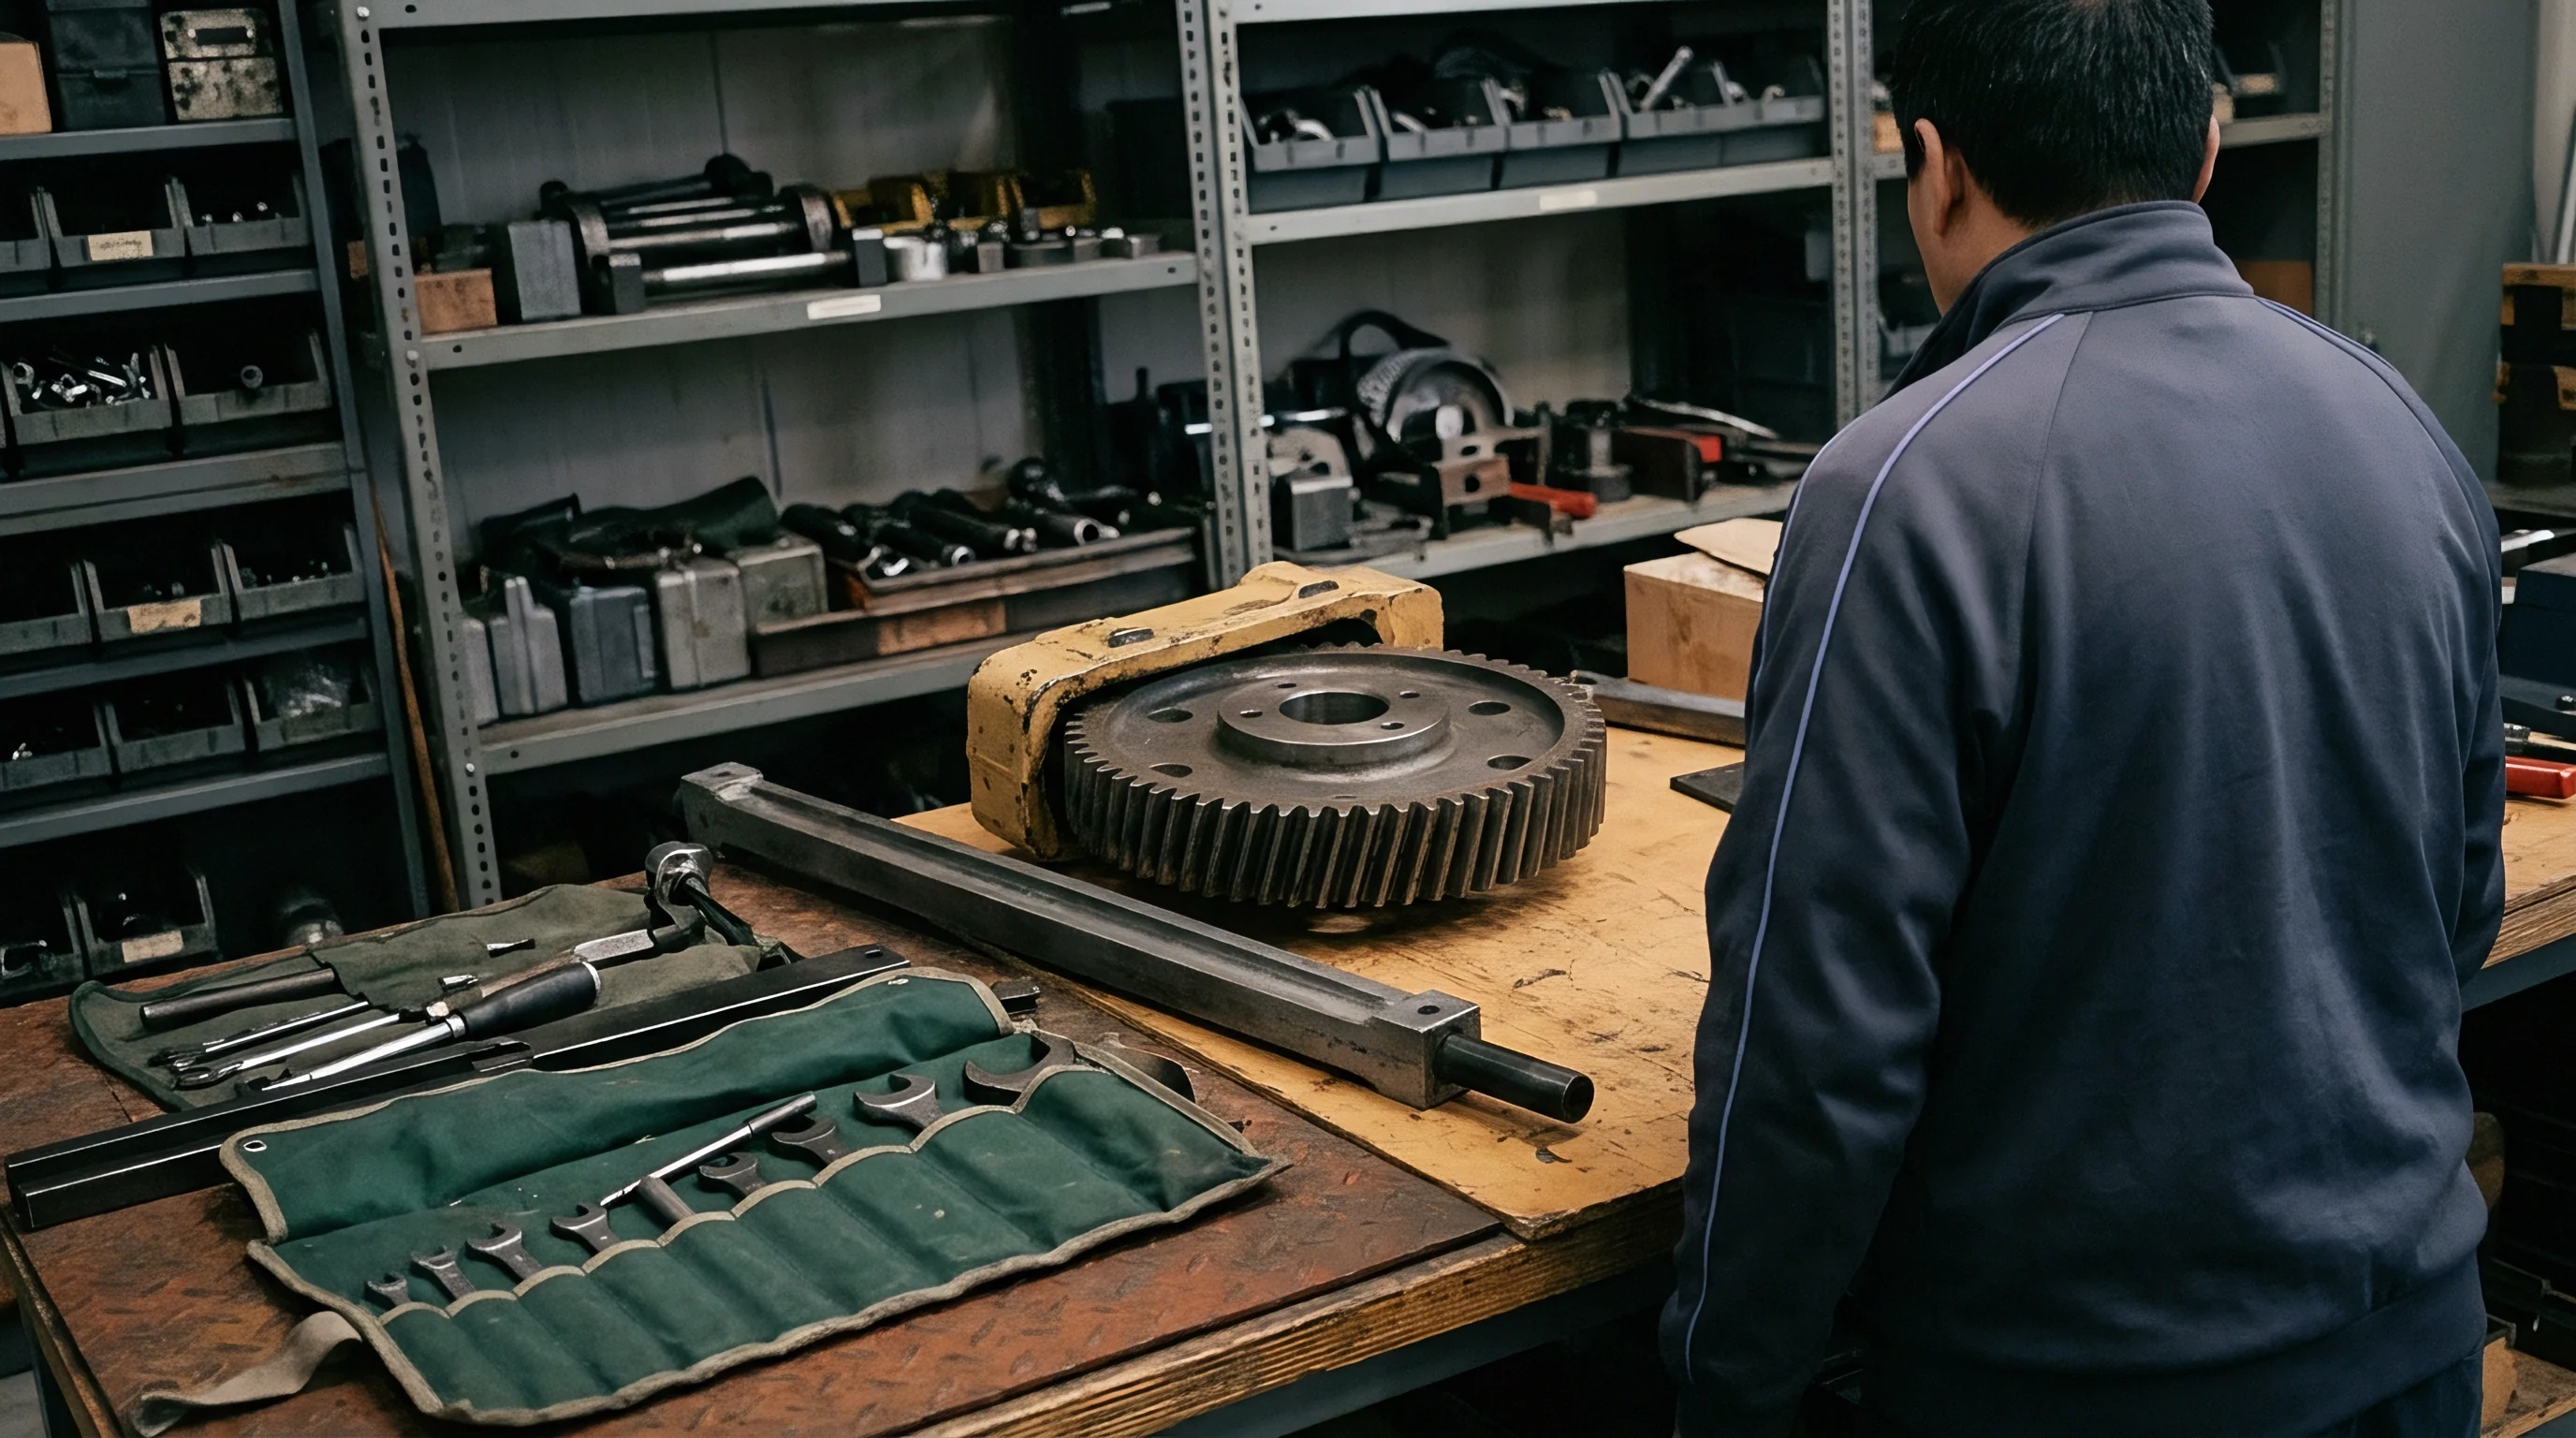
Clamp
Clamping, indexing, and primary forming stations define the physical speed limit of a discrete manufacturing line. Vendors quote nameplate speeds based on dry-cycle bench tests ~ machines running empty without material resistance, hydraulic pressure shifts, thermal expansion, or part variations. Under actual loads, operational cycle times inevitably drift from dry-cycle specs.
Physical forces, heat cycles, tool acceleration limits, and clamp dwell times create non-negotiable delays that tweaking drive frequencies or software parameters cannot fix.
Finding the real constraint at a mechanical station means breaking down its sub-cycle structure. A station rated on paper at sixty cycles per minute spends much of each second on secondary motions: hydraulic actuation, sensor handshakes, vacuum pull-downs, and pneumatic ejections. If raw material thickness creeps toward the upper tolerance limit, clamps need longer dwell times to confirm lock.
That stretches the base cycle from one second to one point three seconds, instantly cutting maximum throughput by more than twenty-two percent.

Nameplate Fallacies in Mechanical Stations
Planning line capacity off vendor sales specs introduces fundamental errors. Vendor engineers run tests in cleanrooms using pre-conditioned, perfectly sized specimens. Plant floors are messier: hydraulic fluids suffer thermal drift, clamp faces wear down, shared pneumatic lines drop pressure, and operator loading speeds vary.
As these factors stack up, a nominal one-second cycle turns into a variable baseline ranging anywhere from one point two to two point zero seconds.
Speed losses compound across stations. A minor delay during clamping ripples both directions down the transfer line. If Station A finishes a part in one point two seconds but Station B takes one point four seconds because of slop in worn locator pins, Station A has to hold its finished part or send it to a buffer.
That micro-stoppage starves downstream stations while forcing upstream feeders to idle against backpressure, straining drive belts and index motors.

Quantifying Micro-Stoppages and Transient Queues
Stoppages under two minutes are the single largest unrecorded loss in automated manufacturing. Plant software often filters out events shorter than three minutes, logging them as normal operation or minor operator touches. But a fifteen-second clamp jam occurring twelve times an hour burns three minutes of production time every hour ~ adding up to twenty-four minutes across an eight-hour shift.
Since these hitches rarely trip enterprise maintenance alerts, engineers blame overall line speed rather than diagnosing a mechanical issue at a specific clamp station.
Catching these transient losses takes high-frequency digital logging directly from the primary PLC inputs. Tracking sensor status down to the millisecond pinpoints the exact sub-cycle stage where the line hangs. The data shows whether delays come from slow proximity switches, pneumatic pressure drops, mechanical binding during tool retracts, or light curtain trips from misaligned parts.

Calculated Throughput Worked Case
To show how far nameplate capacity strays from actual output, consider a six-station automated sub-assembly line. A capital proposal suggested buying a faster secondary press for four hundred fifty thousand dollars to raise throughput from fifteen hundred to two thousand units per hour. A baseline constraint calculation across the six stations using floor execution logs revealed where the actual bottleneck lay.
| Station ID | Station Function | Vendor Nameplate Speed (Units/Hr) | Measured Mean Cycle Time (Sec) | Micro-Stoppage Loss (Sec/Unit) | First-Pass Yield Loss (%) | True Effective Capacity (Units/Hr) |
|---|---|---|---|---|---|---|
| ST-01 | Substrate Infeed & Stamp | 2,400 | 1.52 | 0.18 | 0.5% | 2,108 |
| ST-02 | Hydraulic Clamp & Form | 2,100 | 1.71 | 0.34 | 1.8% | 1,724 |
| ST-03 | Component Insertion | 2,000 | 1.80 | 0.45 | 2.5% | 1,561 |
| ST-04 | Laser Tack Weld | 1,950 | 1.85 | 0.12 | 0.8% | 1,812 |
| ST-05 | Vision Check & Gage | 2,200 | 1.64 | 0.08 | 0.2% | 2,088 |
| ST-06 | Outfeed & Tray Pack | 2,500 | 1.44 | 0.10 | 0.1% | 2,316 |
The analysis showed that Station 03 (Component Insertion) sets the real capacity floor at fifteen hundred sixty-one units per hour. The capital proposal had targeted Station 04 (Laser Tack Weld), which already runs at an effective capacity of eighteen hundred twelve units per hour. Upgrading the weld station would have produced zero additional output at the outfeed, wasting the entire four hundred fifty thousand dollar investment.
Station 03 was losing zero point four five seconds every cycle to automated retries caused by misaligned insertion pins.
Breaking down the numbers for Station 03 shows how those losses add up. The nominal cycle time is one point eight zero seconds. Micro-stoppages add zero point four five seconds, pushing mean execution time per part to two point two five seconds.
That translates to sixteen hundred gross units per hour. Factoring in the station’s two point five percent first-pass yield loss gives the net throughput:
Net Throughput = (3,600 Seconds / 2.25 Seconds/Unit) (1 – 0.025) = 1,560.0 Units/Hour
Fixing the pin alignment at Station 03 cost fourteen thousand dollars in re-machined tooling and sensor upgrades. Trimming zero point three5 seconds off the micro-stoppage delay brought total cycle time down to one point nine zero seconds. Recalculating station capacity yields:
Updated Throughput = (3,600 Seconds / 1.90 Seconds/Unit) (1 – 0.025) = 1,847.3 Units/Hour
That targeted fix raised total line capacity by twenty-eight6 units per hour without buying a single new machine. Balancing a line requires floor measurement; calculating constraints before signing purchase orders prevents throwing capital at non-governing stations.
Standard commercial contracts enforce supplier equipment performance guarantees using gross dry-cycle speeds unless net operational first-pass yield and micro-stoppages are explicitly written into the equipment purchase specification.
An audit team absorbed eighty-five thousand dollars in unrecoverable hours after missing an unrecorded pneumatic pressure drop that triggered constant micro-stoppages during plant expansion validation.

Crate
Buffers, packaging crates, index tables, and accumulation conveyors act as kinetic dampers between asynchronous stations. Designers add accumulation capacity so short upstream stoppages don’t immediately starve downstream operations, or so downstream jams don’t instantly back up into upstream machines. But miscalculating buffer sizes distorts line dynamics.
Accumulation zones often turn brief, obvious stoppages into long, hidden line drag that masks where the primary bottleneck actually lies.
Conveyors hold temporary excess, but sizing them isn’t a simple static calculation based on average machine speeds. Dynamic queue mechanics rule accumulation zones. When an upstream machine outpaces a downstream machine, the buffer fills at a rate equal to the difference between their operating speeds.
Once full, backpressure sensors trip and force the upstream machine to pause. That shifts the operating constraint from the upstream machine’s capability to the downstream machine’s intake rate, moving the bottleneck around the floor based on queue levels.
Which Buffer Size Prevents Downstream Starvation?
Finding the right buffer length means looking at the mean time between failures and mean time to repair for the stations on either side of the zone. If Station A averages four random three-minute stoppages per shift, the buffer leading to Station B must hold enough work-in-progress to keep Station B running at full speed for at least three minutes. Sizing the zone below that threshold guarantees that every trip at Station A starves Station B and drags down overall efficiency.
Over-sizing accumulation buffers introduces severe capital and operational failure modes that degrade plant performance:
- Excess Work-In-Progress Inventory ~ Oversized buffers tie up capital in intermediate inventory queues that eat up valuable floor space and raise holding costs.
- Extended Quality Fault Detection Latency ~ Large buffers delay defect discovery, letting hundreds of bad parts stack up in line before downstream sensors flag the fault pattern.
- Increased Mechanical Transit Damage ~ Packed conveyors build up continuous backpressure where parts rub and collide, leading to scuffing, package crushing, and dimensional damage.
- Masked Machine Reliability Deficits ~ Deep buffers hide underlying equipment issues upstream, making unreliable machinery look dependable when it is actually suffering from constant micro-stoppages.
Buffer design has to account for physical handling limits. Fragile or high-precision components require zero-pressure accumulation systems so parts never touch. These conveyors use zoned sensors and independent motor drives to maintain gaps between items.
They also add control complexity and rely on clean optical sensors. Once sensors get coated in dust or lubricant, the control logic fails and parts pile up, shutting down the line.

Decoupling Mechanics and Storage Saturation
Decoupling production stations with buffer towers or dynamic table accumulators turns a synchronous line into an asynchronous system. On a synchronous line, every station must cycle in lockstep ~ one failure stops everything instantly. Buffers give individual stations freedom to run independently for short windows.
That flexibility costs money and floor space; dynamic towers demand valuable footprint and ongoing maintenance for lift chains, indexing arms, and control boards.
Evaluating whether decoupling actually works means tracking buffer fill levels over long runs. Under normal operating conditions, a well-designed buffer sits around fifty percent capacity. If it sits continuously at ninety-five percent, the downstream machine is undersized relative to upstream output.
If it stays empty, upstream equipment can’t feed downstream demand. In either extreme, the accumulation system provides zero dampening benefit and acts as little more than expensive storage track.
Line balance models show that dynamic buffers operating above eighty percent steady-state capacity lose over seventy percent of their dampening effectiveness against upstream micro-stoppages.
Buffer sizing generally follows the rule of thumb that dynamic storage should hold exactly one point five times the volume consumed during the upstream machine’s mean time to repair.
Shift
Shift handovers, break patterns, crew skills, and working schedules introduce large periodic swings in production output. Capital plans often treat labor as a constant, assuming a machine rated for fifty units per minute produces the same volume regardless of who is running it. Plant floor data tells a different story.
Shift schedules create sharp, predictable drops in output at specific times of day. Failing to account for handover losses, changeover variance, and operator fatigue leads companies to buy unnecessary machinery to cover shortfalls caused by schedule design and labor execution.
Product changeovers are the single largest source of labor-driven output variance on multi-product lines. Vendor specs quote changeover times recorded by factory technicians using pre-set tooling in ideal conditions. Third-shift operators on the plant floor often take two to three times longer to swap tools, recalibrate sensors, align rails, and run test parts.
That extra setup time eats up scheduled production hours, creating volume shortfalls that management wrongly blames on equipment speed.

Changeover Losses and Operating Schedules
Changeovers pull productive hours straight out of the operating schedule. Cost accounting often classifies changeover duration as planned downtime, removing it entirely from overall equipment effectiveness calculations. That creates a blind spot: a line achieving ninety percent effectiveness over a four-hour run after spending four hours on setup delivers only forty-five percent asset utilization across that shift.
Buyers looking at OEE without checking total schedule availability buy extra machinery to fix what is actually a setup efficiency problem.
Skill gaps between crews drive noticeable output swings between shifts. Experienced operators anticipate misfeeds, tweak tension guides before drift trips a sensor, and run fast visual checks while the line moves. Less experienced crews only react after automated alarms trigger full shutdowns.
Audit logs consistently show Senior Crew A generating twenty percent more output than Junior Crew B on the exact same equipment and product run.
Operator Skill Spread and Handover Degradation
Shift handovers create concentrated production dips. Standard plant rules might specify a fifteen-minute overlap between crews, but in practice outgoing operators begin throttling back line speed thirty minutes before the bell to avoid leaving active jams. Incoming crews then spend thirty to forty-five minutes checking logs, grabbing gear, discussing material lots, and tweaking settings before getting back up to rated speed.
Auditing the shift boundary execution requires implementing a structured physical measurement procedure across ten consecutive operating shifts.
- Record the exact timestamp when the outgoing shift slows line feed below target speed.
- Log the handover conversation length and note whether anyone monitors the machinery during the transition.
- Document every tweak incoming operators make to controls, rails, regulators, or sensors during their first sixty minutes on station.
- Measure the exact delay between incoming crew arrival and reaching steady-state target speed.
- Correlate handover parameter changes with defect rates or micro-stoppages logged over the next two hours.
Auditing those transitions exposes the actual volume lost to shift changeovers. Across three shifts, handover friction frequently destroys up to seventy-five minutes of full-speed production a day. That represents over five percent of total daily capacity ~ a direct operational loss that faster downstream machinery can never recover.
Standard equipment contracts use performance specs like VDI 3423 to calculate availability guarantees, explicitly stripping operator setup delays, shift changes, and scheduled maintenance out of the baseline uptime equation.

Paperwork
QA sign-offs, batch releases, ERP transactions, and offline regulatory holds act as invisible administrative bottlenecks that physically stop production lines. Operations teams invest millions in high-speed automation while ignoring the administrative workflows needed to move material between stations. When rules prevent a batch from advancing to secondary packaging until lab assays clear, the production line turns into an expensive holding rack waiting for sign-offs.
Paperwork stops physical movement whenever administrative steps take longer than machining steps. In regulated industries like pharma, medical devices, aerospace, and food processing, quality holds control physical release gates. A line capable of running fifty packaging crates per hour will sit idle if quality control takes six hours to verify batch logs from the previous run.
Increasing machine speed in that situation only moves material faster into the administrative brick wall, filling staging areas and forcing early shutdowns.

Quality Hold Latency and Release Gates
Hold delays cause floor congestion that directly cuts throughput. While intermediate lots await testing, operators store them in quarantine bays. Once those bays hit capacity, safety codes and quality protocols prevent staging extra inventory in the aisles.
The line has to shut down because completed parts have nowhere to go. Capital buyers routinely miss this bottleneck because hold delays are logged in laboratory management software rather than machine downtime reports.
Offline testing creates identical administrative stalls. High-speed lines often require periodic sampling ~ pulling five finished parts every two hours for CMM dimensional verification. If the CMM lab gets backed up, parts pile up at the inspection bench.
If SOPs prevent the line from starting the next lot until the lab approves the sample, a multi-million dollar line sits waiting for someone to click an approval button in software.
Batch Record Clearance as a Line Constraint
Manual batch logging is a persistent labor friction point. Operators tasked with recording temperatures, pressures, lot numbers, and torque values onto paper records have to step away from active machine monitoring. While they fill out sheets, minor misfeeds and alignment issues go uncorrected, escalating into major jams that trip automated safety stops.
Removing administrative friction requires tying digital batch systems directly into machine controls. Automated data capture records process parameters in real time, clearing electronic batch records continuously without manual logging. That eliminates manual entry delays and keeps incomplete paperwork from halting production.
To compare buying high-speed equipment upgrades against resolving administrative and mechanical bottlenecks, consider four capital allocation options mapped below.
| Intervention Option | Scope of Action | Capital Cost (USD) | Implementation Time (Weeks) | Net Line Capacity Gain (Units/Hr) | Unit Cost Reduction ($/Unit) | Simple Payback Period (Months) |
|---|---|---|---|---|---|---|
| Option A | Purchase High-Speed Filler Machinery | $850,000 | 36 | +120 | $0.04 | 48.2 |
| Option B | Install Dynamic Zero-Pressure Accumulator | $320,000 | 16 | +280 | $0.11 | 14.1 |
| Option C | Implement Electronic Batch Record System | $140,000 | 8 | +310 | $0.14 | 6.2 |
| Option D | Optimize Intake Dock & Retool Station 03 | $68,000 | 4 | +340 | $0.18 | 2.8 |
The comparison shows that Option D ~ combining dock schedule optimization with retooling the Station 03 clamp assembly ~ yields the largest gain (three hundred forty units per hour) at a fraction of Option A’s cost. Option A (purchasing a high-speed filler) costs eight hundred fifty thousand dollars and takes thirty-six weeks to deliver, but adds just one hundred twenty units per hour because dock starvation and quality holds still govern output. Option C, resolving hold latency with electronic batch records, delivers a six point two month payback, proving that fixing non-mechanical constraints often yields far better capital efficiency.
Implementing effective paperwork and administrative constraint controls requires enforcing strict document release gating criteria across the operational workflow:
- Electronic Parameter Capture Validation ~ Sensors must stream critical process data directly to the database, eliminating manual operator logging during production runs.
- Automated Quarantine Tracking ~ Quality hold logic should integrate with warehouse software to assign virtual quarantine statuses instantly without forcing physical inventory moves.
- Real-Time Laboratory Assay Integration ~ LIMS platforms must push approval signals straight to the line PLC to release outfeed gates without waiting for manual sign-offs.
- Parallel Batch Clearance Protocols ~ Batch record reviews should run alongside secondary packaging rather than acting as a sequential prerequisite for physical movement.
Quality gates can stall operations. Setting up streamlined compliance workflows keeps administrative steps supporting line flow rather than blocking output.
Which undocumented administrative sign-offs or manual QA review gates are active in a plant right now, quietly capping the throughput of current or planned equipment?

Lease
Signing purchase orders, lease agreements, or vendor supply contracts before identifying true line constraints is a common way to waste corporate capital. Buyers under pressure to hit volume targets routinely sign contracts based on vendor spreadsheet models that assume flawless execution. Once signed, the buyer assumes full financial liability for the machine, whether it fixes the underlying bottleneck or sits idle behind unaddressed intake, labor, mechanical, or administrative delays.
Capital expenditures fix nothing on their own. Protecting investments requires tying procurement contracts to performance milestones measured on the plant floor. Buyers should reject standard vendor agreements that set payment schedules by calendar dates or shop acceptance tests.
Factory acceptance tests prove only that a machine dry-cycles in a controlled vendor shop. Real financial protection comes from tying payment gates to Site Acceptance Testing under operational conditions ~ including raw material variations, actual shift crews, and real downstream backpressure.

Stage-Gating the Capital Purchase Order
Modern procurement contracts must include strict performance conditions governing capital disbursement at every stage. Payment schedules ought to hold back at least thirty percent of total contract value until the machine demonstrates net effective operating capacity on the floor across thirty consecutive shifts. If equipment misses agreed throughput targets because of design flaws or integration issues, terms should give the buyer the explicit right to require vendor-funded re-engineering or return the machine for a full refund.
Writing precise technical definitions into purchase agreements prevents disputes later on. Vendors routinely use vague terms like “rated mechanical speed” or “nominal design capacity.” Buyers should replace these with clear metrics: “Net operational first-pass yield of ninety-nine point two percent at a minimum continuous throughput of two thousand units per hour over a eight-hour shift, inclusive of all mechanical sub-cycle times and micro-stoppages under zero point five seconds.”

Milestone Contracts and Performance Guarantees
When drafting purchase orders or leases, buyers must include binding warranty and remedy clauses tied to constraint resolution. Contracts should require vendors to perform a complete line integration study before finalizing machine specifications. If the machine fails to deliver projected capacity gains because the vendor misjudged upstream or downstream constraints, the contract should require the vendor to provide any necessary buffers or tooling upgrades at no additional cost.
Calculating line bottlenecks before placing equipment orders turns procurement into an exact engineering exercise. Analyzing intake variance, clamping sub-cycle losses, accumulation buffer dynamics, shift handovers, and quality hold workflows unlocks substantial hidden capacity in existing assets. When buying new machinery remains necessary, grounding contracts in floor data ensures every dollar spent directly eliminates governing constraints, maximizing return on capital.