Auditing Contract Manufacturer Overall Equipment Effectiveness before Scale up Commitments
Auditing contract manufacturer equipment effectiveness across all calendar hours exposes hidden downtime and fixes real production limits before capital expansion.


Registry
Production logs delivered during supplier qualification routinely report line efficiency figures between eighty-five and ninety-two percent. Factory management presents these summaries on printed shift rosters to demonstrate that capacity is ready for commercial ramp. The raw machine data tells a separate story.
Event logs pulled directly from programmable logic controllers reveal that unrecorded micro-stoppages, offline buffer adjustments, and unallocated cleaning windows systematically inflate the reported run time. The headline metric tracks planned machine cycles while ignoring true cell output against time paid.
Operating definitions across contract manufacturing agreements disguise this variance through customized calendar exclusions. A plant running twenty-four hours a day often calculates equipment effectiveness against a planned production window of only sixteen hours. The plant treats tooling changeovers, preventative maintenance, break relief, and material staging as scheduled non-operating events.
Under ISO 22400-2 definitions for manufacturing operations, total operating time accounts for every available hour on the calendar. Contract manufacturers narrow the denominator to suppress line instability before presenting utilization figures to prospective brand owners.
Audited lines running continuous three-shift operations drop an average of nineteen percentage points when calculated against total factory hours rather than contractor-filtered run time.
Line audits require complete extraction of internal enterprise resource planning transactions and work-order completions. Discrepancies between printed plant metrics and enterprise ledgers expose how facilities handle process interruptions:
- Unscheduled die resets receive categorization as planned maintenance whenever line technicians lack immediate replacement components.
- Operator lunch relief shortages enter the dispatch system as customer-driven scheduling pauses rather than labor deficits.
- Rework loops behind the primary pack-out station run without work orders to keep defective parts off scrap ledgers.
- Secondary packaging starvations disappear into utility interruption categories during shift changeovers.
Diligence examiners compare job tickets against supervisory control and data acquisition databases. When scrap parts leave the workstation without scan codes, finished lot yields appear artificially elevated while operating run rates hide substantial cycle degradation. Auditors inspect serial number registries against shipping manifests to identify ghost units manufactured during unlogged night runs.
A supplier explains this discrepancy by claiming that shop floor sensors register false pauses whenever operators adjust feed rails manually.

Rig
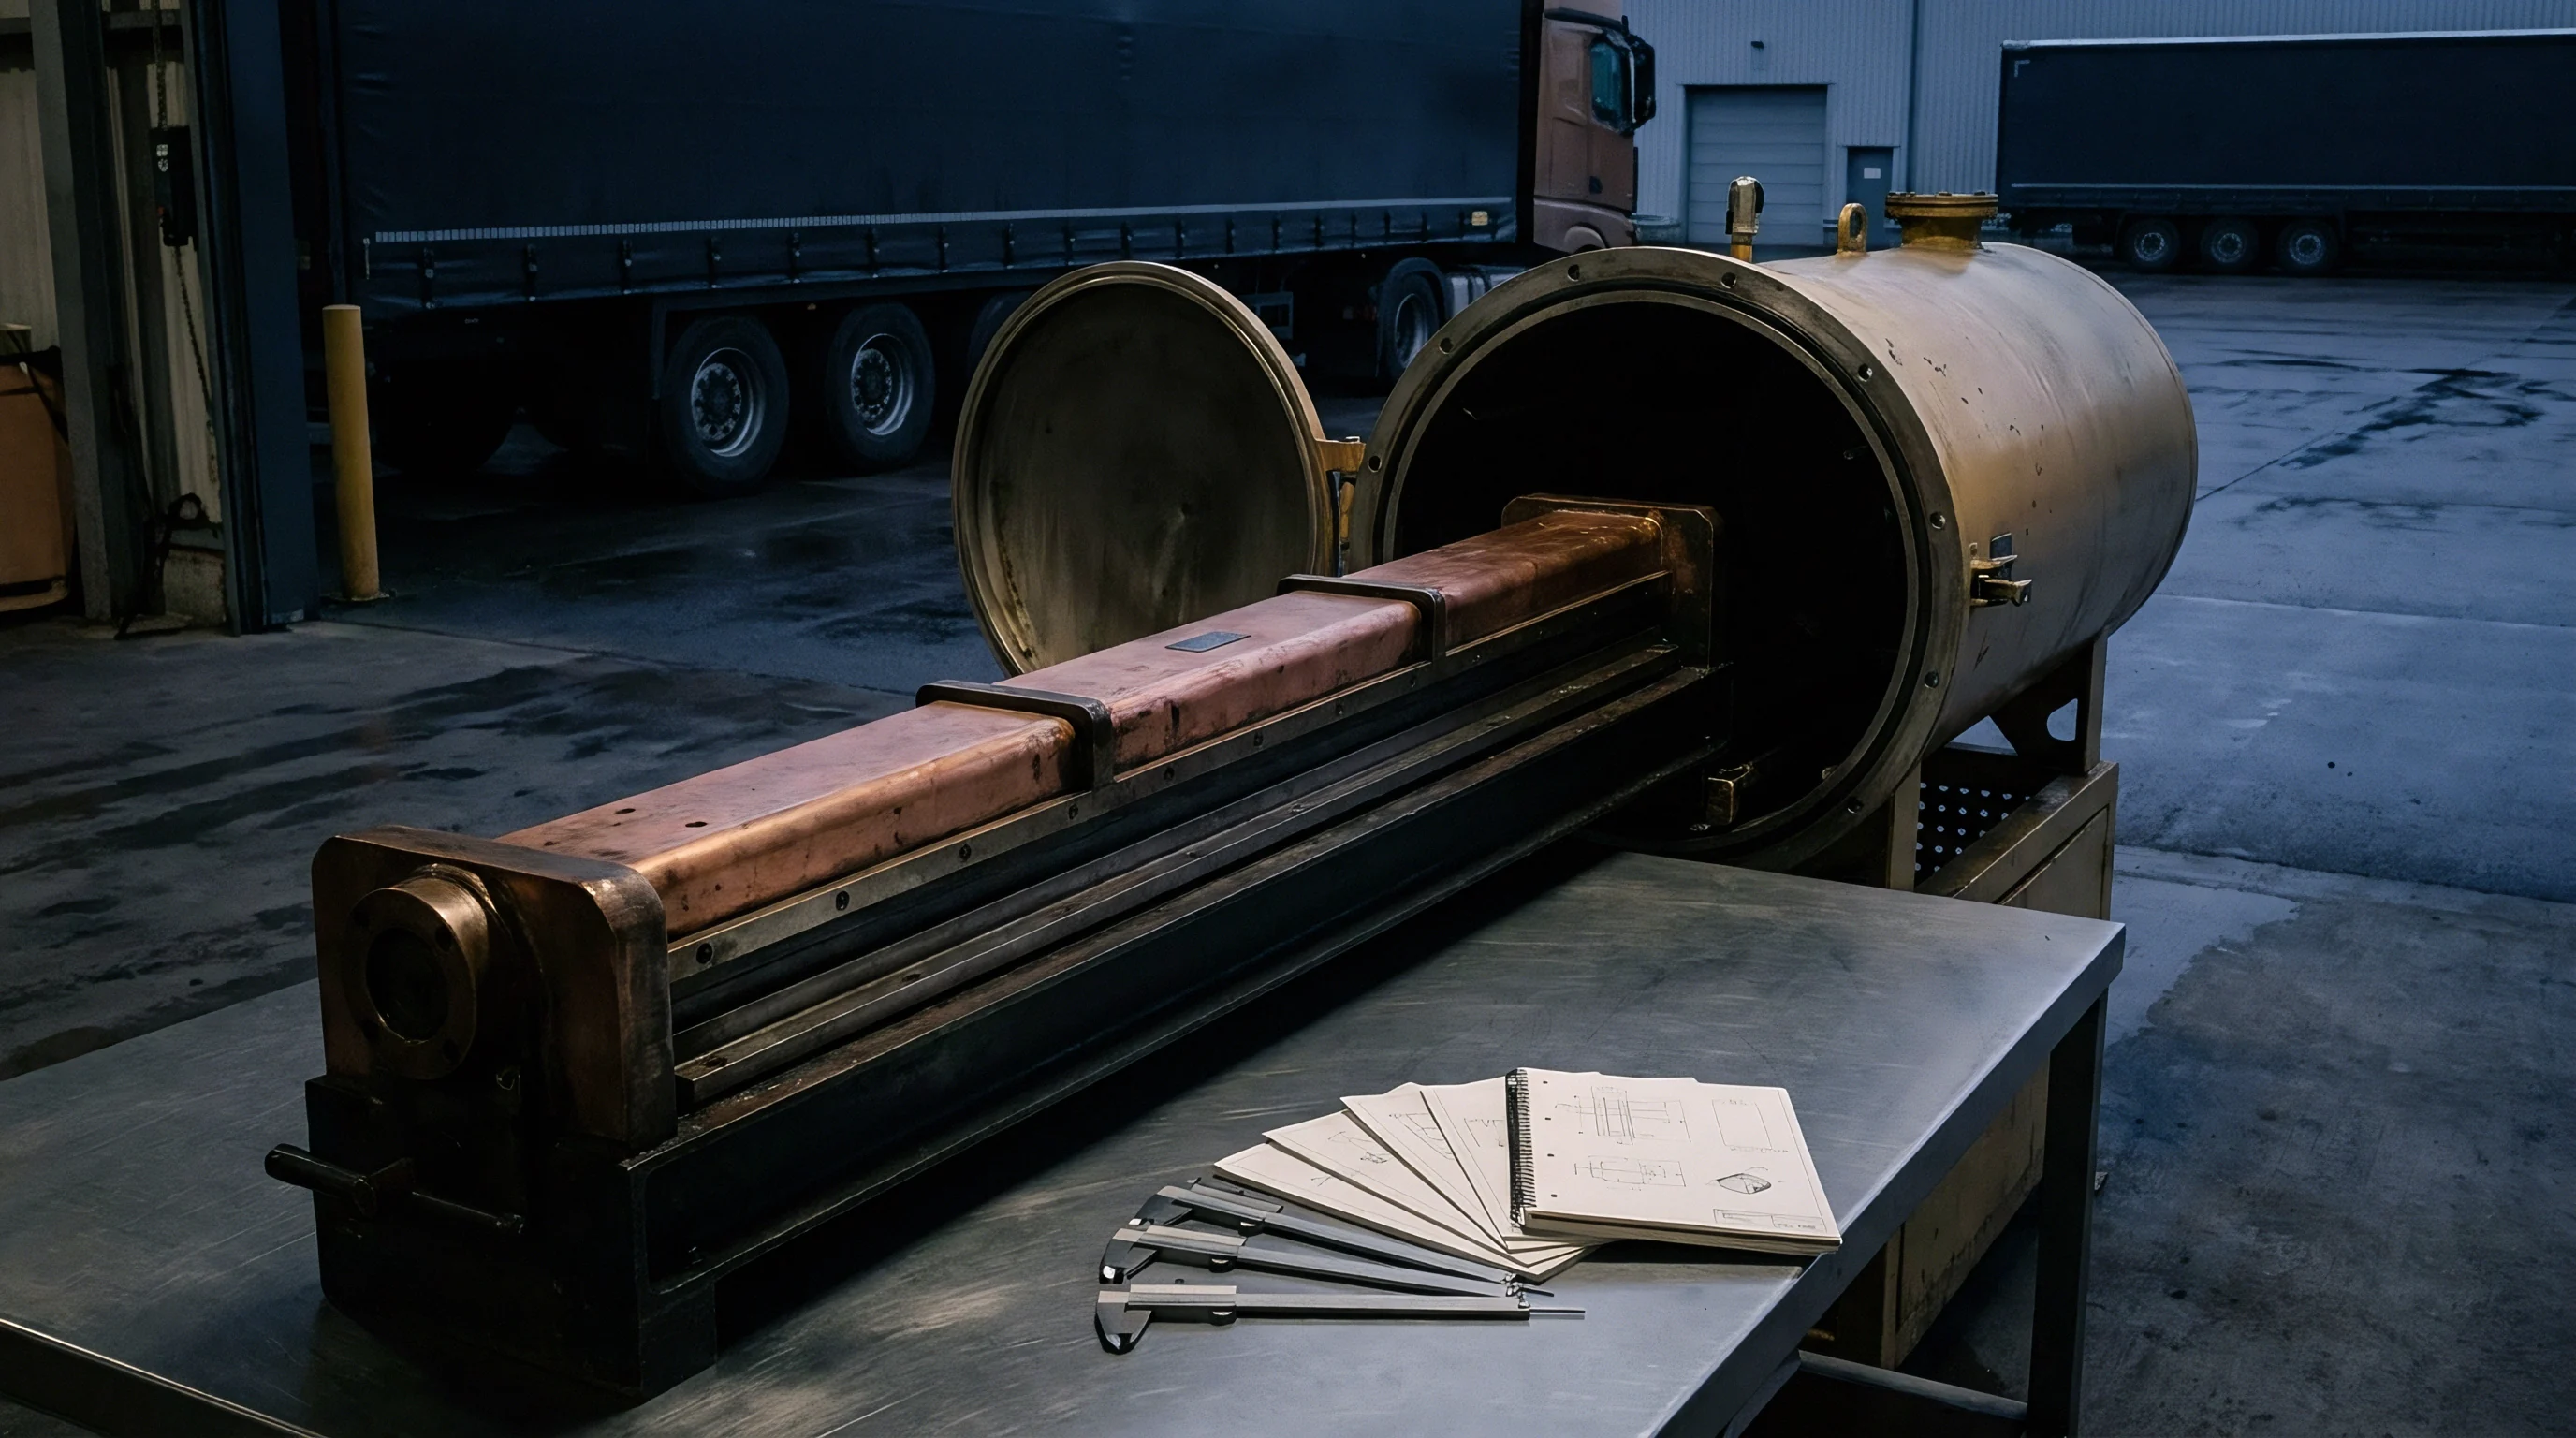
Tooling geometry and mechanical constraints fix the physical ceiling of any assembly cell. Solder paste printers, automated optical inspection cells, and robotic pick-and-place gantry heads dictate the pace of downstream packaging. When a manufacturer claims eighty percent operational effectiveness on an automated assembly line, physical verification of the constraint station settles the claim.
Machine builders supply theoretical cycle rates based on clean mechanical movements using pristine test coupons. Production environments force machines to handle dimensional tolerances in real substrates, component packaging variations, and thermal drift.

Upstream Feed Mechanisms
Component feeders generate more micro-stoppages than any central processing station. Solder deposition thickness drifts across consecutive circuit boards, prompting automated optical inspection systems to pause the conveyor for manual verification. Pick-and-place nozzles collect dust, mispick miniature passives, and trigger three-second purge sequences that plant supervisors omit from shift logs.
Ten pauses of twenty seconds each hour erode three percent of total line availability without tripping supervisory maintenance alarms.
Shop-floor audits isolate the governing constraint station by tracking physical work in progress accumulation across intermediate transfer zones. Conveyors jammed between surface mount placement machines and reflow ovens demonstrate line balancing failures that standard shift metrics smooth over. When line engineers widen sensor tolerances to prevent line stoppages, defect rates rise at subsequent testing stages.
Downstream buffers always drain when the governing constraint machine halts.
Evaluating automated cells before volume commitment requires verifying mechanical readiness directly at the hardware interface:
- Feeder reel changeover mechanisms must accept splices without human intervention halting the indexing table.
- Pneumatic line pressure gauges should register stable operating thresholds throughout peak plant compressor demands.
- Optical sensor lenses show zero oil mist deposition from adjacent pneumatic exhaust ports.
- Mechanical pick heads hold calibrated vacuum retention values during high-speed lateral indexing maneuvers.
Uncalibrated pick mechanisms drop components during rapid repositioning steps. When plants turn down machine traverse velocities to prevent dropped components, total cycle times expand beyond contract modeling parameters. The line meets its nominal availability metric while losing substantial performance effectiveness.
The governing station sets the real rate of the whole factory floor regardless of nominal nameplate ratings.


Leakage
Line efficiency breaks down into three interrelated operational factors: availability, performance, and first-pass output. Each factor conceals operational deficits that compound through multiplication. An availability factor of ninety percent, a performance factor of eighty-five percent, and a quality factor of ninety percent produce an overall efficiency score below sixty-nine percent.
Contract manufacturers separate these factors across disparate operational reports, obscuring systemic waste behind isolated component ratings.
| Loss Classification | Nominal Allowance | Audited Consumption | Root Cause Mechanism | Impact Factor |
|---|---|---|---|---|
| Tooling Setup and Adjustment | 3.0% | 8.4% | Missing offline setup carts and manual fixture realignment | Availability |
| Component Feed Jamming | 1.5% | 6.2% | Out-of-spec carrier tape sprockets and feeder wear | Availability |
| Deposition Rate Derating | 0.0% | 7.5% | Squeegee speed reduced to manage high-viscosity paste | Performance |
| Micro-Idling Under Three Minutes | 2.0% | 9.1% | Conveyor handoff timing mismatches between stages | Performance |
| Thermal Stabilization Scrappage | 0.5% | 2.8% | Reflow zone temperature profile hunting during restarts | Quality |
| In-Circuit Test Failures | 1.0% | 4.3% | Tombstoning components caused by uneven thermal mass | Quality |
Availability and Performance Erosion
Equipment availability falls rapidly during unscheduled product changeovers and minor adjustments. Operators spend unmonitored production hours hunting for specialized wrenches, aligning rails, and purging nozzles. Facilities without standardized staging operations absorb massive setup penalties that shift supervisors record as scheduled production pauses.
Performance effectiveness suffers equally when operators deliberately dial back line speed to avoid recurring feeder jams.
Quality deficits introduce the most destructive compounding costs. Defective units produced during line stabilization draw raw material inventory, consume constraint machine capacity, and tie up diagnostic technicians. Rework stations staffed by uncertified operators introduce secondary mechanical stress into assemblies, generating latent defects that pass functional bench tests but fail in field deployment.
- Raw material staging gaps leave primary placement stations idling while material handlers reconcile inventory stockouts in central stores.
- Sub-optimal cycle velocities conceal mechanical misalignment, doubling the planned run time required to complete agreed batch quantities.
- Uncontrolled test rejects cycle back through manual re-soldering stations without revision tagging, polluting lot traceability records.
- Batch rework backlogs accumulate on the production floor, consuming staging real estate and inflating working capital requirements.
Yield loss at late-stage assembly stations wastes every operational dollar invested by preceding stations. An uncorrected process variance at the final packaging or functional test cell forces the complete write-off of complex assemblies containing expensive silicon and precision machined housings. Overlooking hidden manufacturing friction during initial capacity assessments triggers severe inventory shortfalls when volume demand peaks.


Trial
Verification audits demand controlled demonstration runs conducted under continuous commercial shift patterns. A single pilot run of four hours tells nothing about thermal drift, machine wear, or operator turnover. The facility must demonstrate process stability across forty-eight to seventy-two consecutive operating hours.
Production lots running during third shifts and weekend rotations expose labor depth issues and maintenance coverage gaps that daytime audits miss.

Statistical Validation Protocols
Process capability evaluations rely on machine run records evaluated through statistical process control parameters. The buyer establishes continuous data logging across critical-to-quality dimensions, capturing machine spindle velocities, clamp pressures, and reflow profile variations. Auditors verify that the line sustains a minimum process capability index of 1.67 for designated critical features throughout the full duration of validation trials.
Equipment utilization records pulled during qualification must document all tool replacements and abrasive wear adjustments. When tooling components require replacement prior to scheduled service intervals, tool life assumptions built into unit economics collapse. Technicians collect physical scrap, sort rejected parts by failure classification, and log component lots to isolate defective raw inventory from true machine processing errors.
| Shift Identifier | Gross Operating Time | Actual Run Time | Units Input | Finished Output | Audited Metric |
|---|---|---|---|---|---|
| Shift 1 Day Operations | 480 min | 412 min | 2,400 | 2,246 | 76.4% |
| Shift 2 Swing Operations | 480 min | 385 min | 2,400 | 2,112 | 68.2% |
| Shift 3 Graveyard Operations | 480 min | 340 min | 2,400 | 1,890 | 54.7% |
Audit personnel conduct real-time line tracking during production shifts. The examiner records machine stops directly, using manual stopwatches to cross-reference automated plant telemetry. Small adjustments to optical sorting cameras, sensor overrides, and conveyor nudges appear in auditor field books even when plant control software registers normal running conditions.
Auditing teams verify that line supervisors run machines at nominal speeds without overriding programmed safety interlocks or optical inspection thresholds.
Auditors confirm operational readiness through systematic verification tasks:
- Extract native log files directly from machine controller hard drives to bypass plant summary databases.
- Reconcile electrical consumption curves against recorded machine cycle events to pinpoint unlogged line idleness.
- Inspect maintenance logs for recurring corrective interventions on primary constraint assemblies.
- Audit shift-to-shift handover procedures to confirm that process adjustments carry forward without resetting tool settings.
Discrepancies between day shift outputs and overnight production shifts frequently reveal hidden dependencies on informal operator techniques rather than repeatable operating procedures. Whether the contract manufacturer possesses the institutional discipline to maintain line stability when engineering supervisors leave the floor remains an unanswered operational question.

Remedy
Commercial contracts link capital deployment to verified shop-floor metrics. Scale-up commitments must not proceed based on verbal assurances or unverified production spreadsheets. Buyers structure multi-stage capacity release agreements where tooling outlays and production purchase orders depend on demonstrated line effectiveness.
Contract clauses define overall equipment effectiveness strictly using total facility hours as the base denominator, eliminating ambiguous exclusions for tooling setups or scheduled shift breaks.
When line audits demonstrate an efficiency gap, the commercial agreement dictates operational remedies. The contract establishes mandatory dedicated engineering support, funded entirely by the manufacturer, to resolve constraint station bottlenecks. The supplier commits to secondary line qualification at an alternate facility if line yield metrics fail to cross agreed thresholds within thirty days of commercial ramp milestones.
Standard supply agreements incorporating ISO 22400-2 total calendar hour formulas assign financial liability for line capacity shortfalls directly to the contract manufacturer.
Capacity reservation agreements penalize suppliers who misrepresent plant availability. If the contract manufacturer diverts qualified assembly lines to serve other clients, the buyer exercises audit inspection rights backed by pre-agreed liquidated damages. Production contracts tie pricing tiers directly to audited scrap rates, preventing suppliers from passing rework costs into finished unit pricing.
The master services contract specifies that failing to maintain a demonstrated operational efficiency score of seventy-five percent across consecutive production runs triggers an immediate buyer right to repossess specialized tooling without cancellation fees.