Deriving Temperature Derating Factors for Polymer Fatigue Characterization in Engineering Resins
Polymer fatigue temperature derating derives from isothermal S-N curves and viscoelastic shift equations adjusted for cyclic hysteretic heat buildup.


Baseline
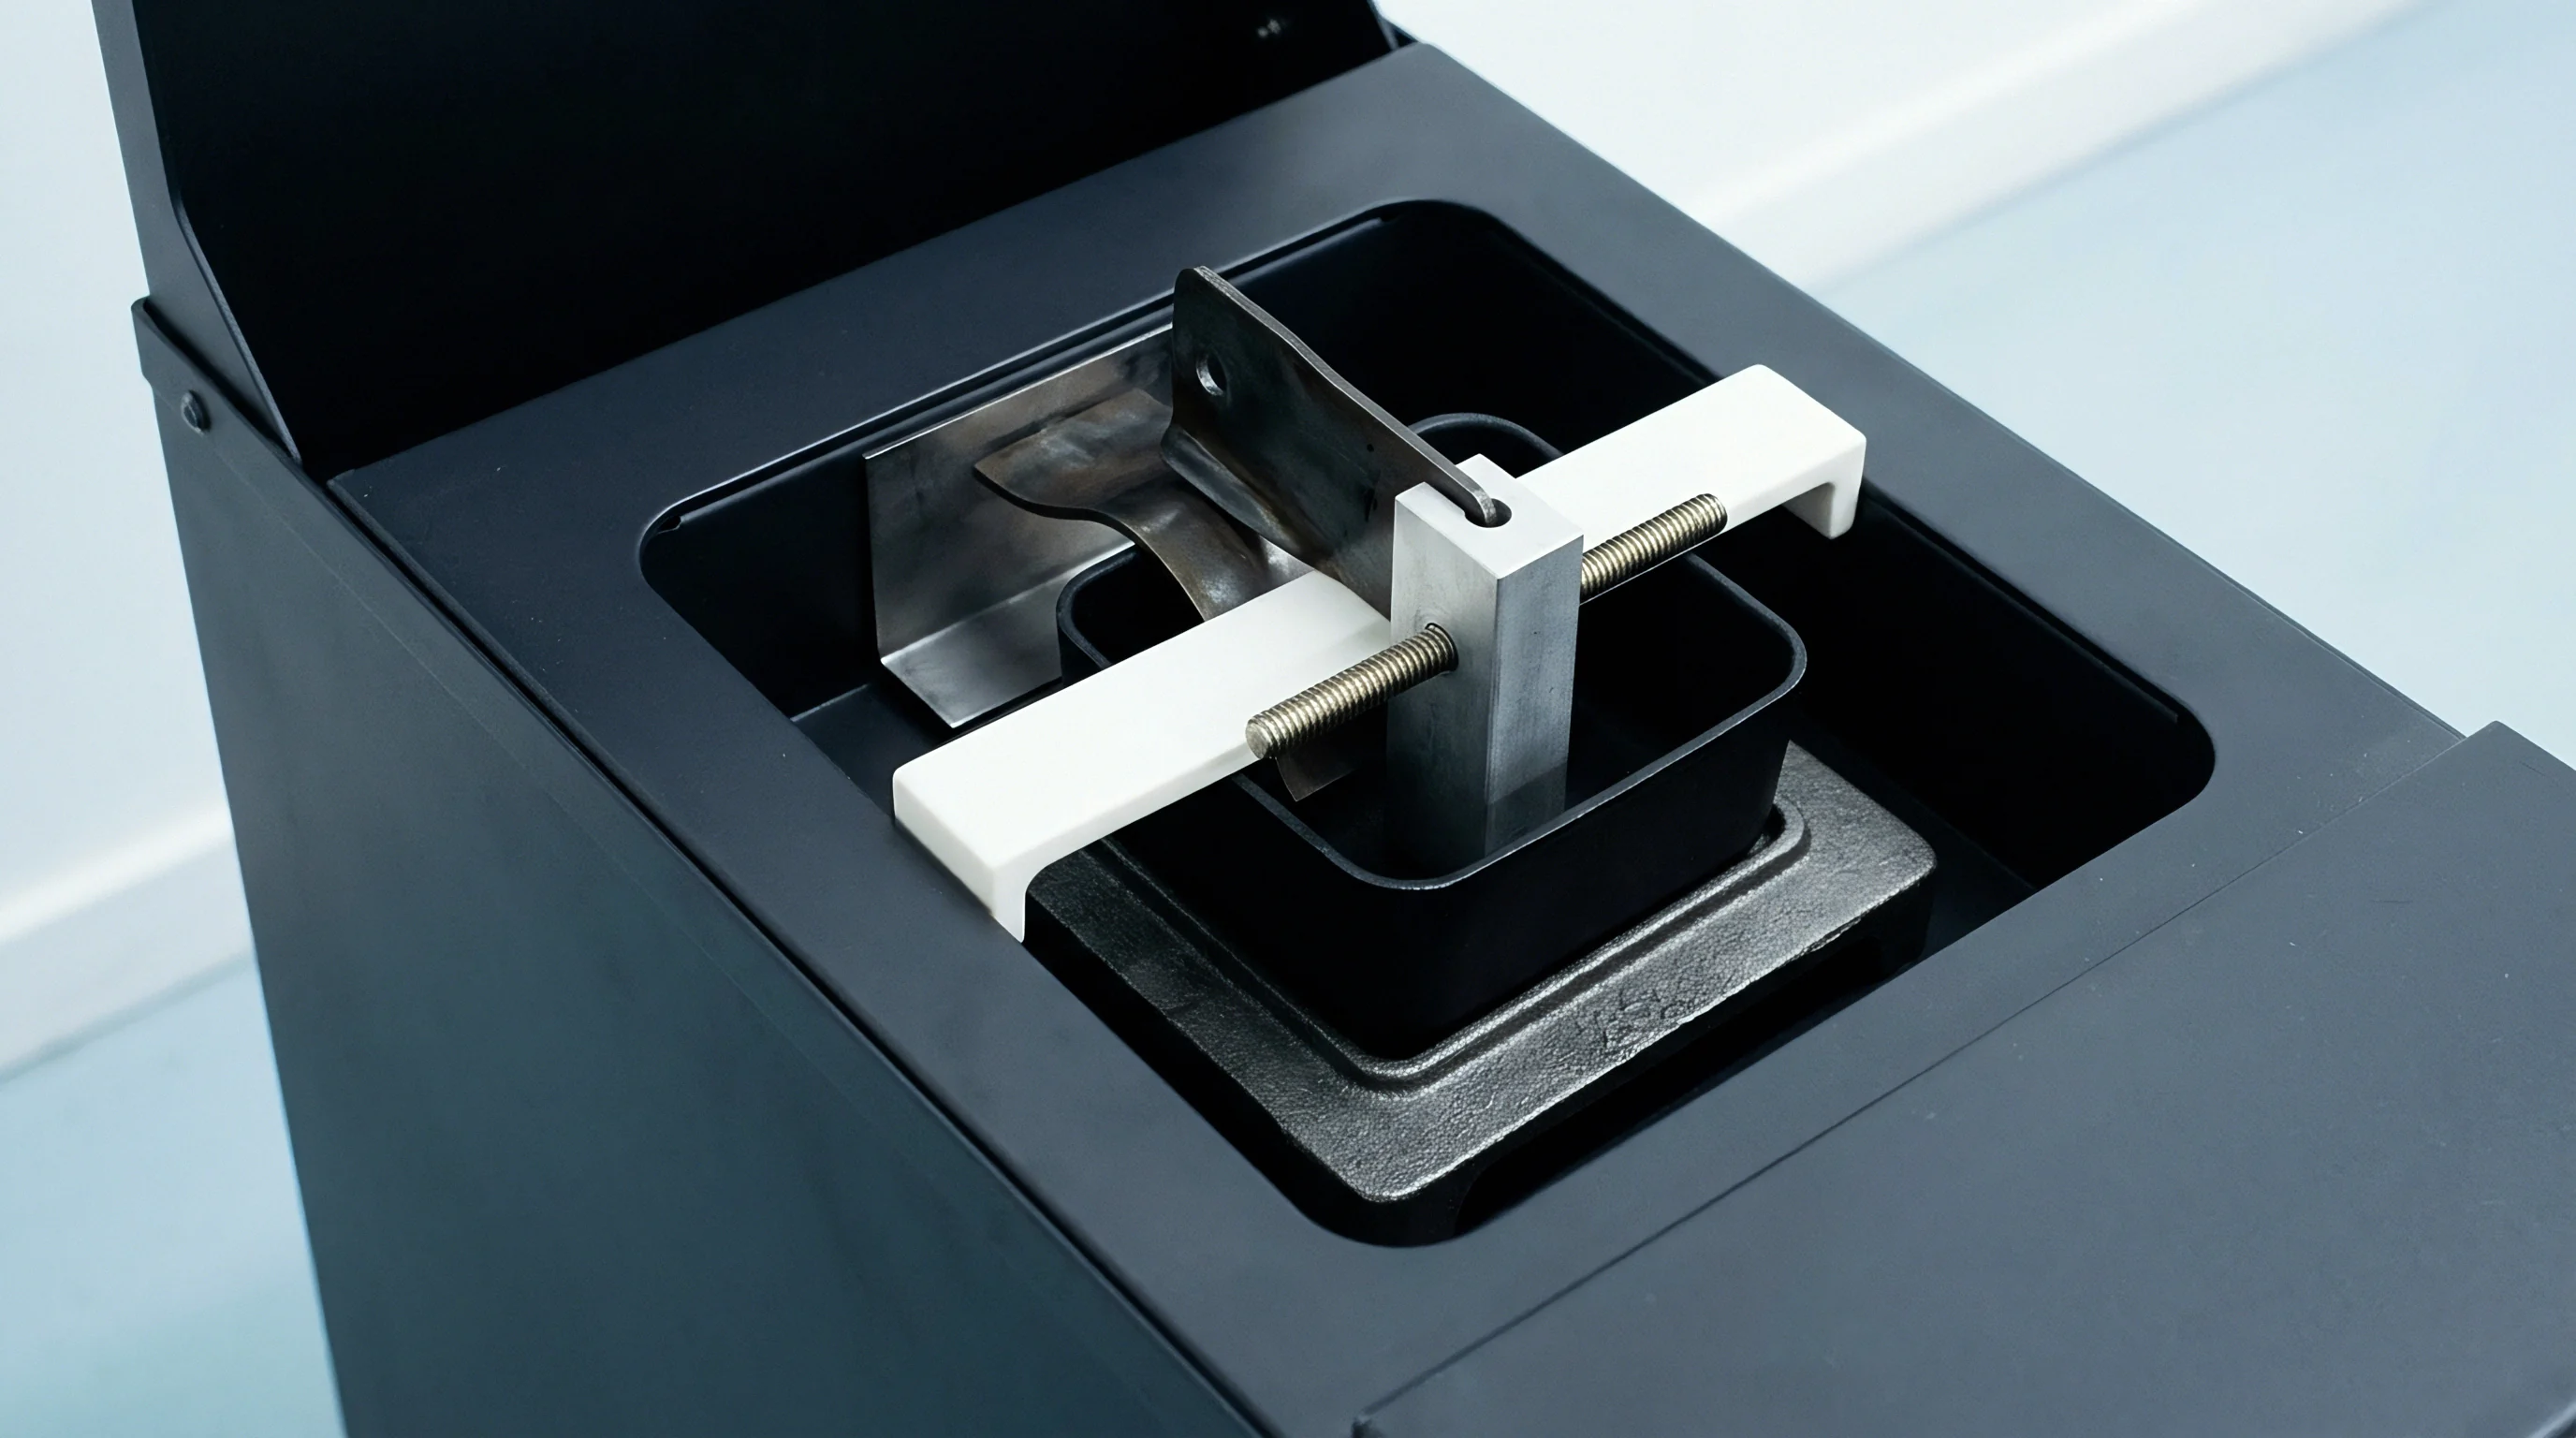
Reference States and Derating Mechanics
Engineering thermoplastics undergo cyclic mechanical degradation through combined viscoelastic dissipation and microstructural crack growth. Establishing an endurance limit for unreinforced or fiber-reinforced polymers demands a defined reference temperature, standardized at twenty-three degrees Celsius under dry-as-molded conditions. When operating temperatures diverge from this laboratory state, tensile fatigue strength drops nonlinearly.
The temperature derating factor, expressed as a scalar multiplier between zero and one, scales the permissible alternating stress amplitude at a designated cycle count.
Fatigue characterization curves derived from uniaxial coupon testing under ASTM D7791 or ISO 13003 display steep downward shifts as ambient test cell temperatures rise. Polymeric chains experience elevated segmental mobility as thermal energy enters the amorphous phase. This mobility accelerates secondary creep, blunts crazing resistance, and lowers the threshold stress intensity factor for crack initiation.
Structural qualification packages that apply static thermal knockdowns directly to fatigue load cases underestimate high-cycle failure rates by wide margins.
Ambient test bench calibrations hold valid only when specimen core temperatures match the controlled chamber environment within half a degree Celsius.
The calculation of the derating factor begins with isothermal Wöhler lines generated across discrete thermal increments. For semicrystalline resins like polybutylene terephthalene and aliphatic polyamides, test sweeps typically run at twenty-three, fifty, eighty, and one hundred twenty degrees Celsius. The derating coefficient represents the ratio of the fatigue strength at elevated temperature to the baseline fatigue strength at twenty-three degrees Celsius for a fixed life target, customarily ten million cycles.
Designers map these coefficients across the component service envelope to construct derating curves.
| Resin Grade | Glass Transition (C) | Strength at 23C (MPa) | Derating at 60C | Derating at 90C | Derating at 120C |
|---|---|---|---|---|---|
| POM Copolymer Unfilled | -50 | 38.0 | 0.68 | 0.45 | 0.24 |
| PA66 Unreinforced DAM | 55 | 42.0 | 0.54 | 0.31 | 0.18 |
| PA66 30% Glass Reinforced DAM | 60 | 98.0 | 0.74 | 0.52 | 0.36 |
| PBT 30% Glass Reinforced | 45 | 82.0 | 0.71 | 0.49 | 0.33 |
| PEEK Unfilled | 143 | 88.0 | 0.91 | 0.82 | 0.71 |
Data points diverge sharply when the operating window crosses the glass transition region. Glass fiber reinforcements maintain structural integrity above this thermal boundary by carrying principal tensile vectors, though the polymer matrix continues to shed load-bearing capability. Semicrystalline matrices retain modest load bearing via crystalline spherulites, whereas wholly amorphous polymers such as polycarbonate lose structural stiffness completely once thermal inputs approach their softening threshold.
ASTM D7791 Section 10.2 dictates that test reports register specimen surface temperature continuously, automatically discarding any run where surface readings rise more than three degrees Celsius above the environmental chamber baseline.
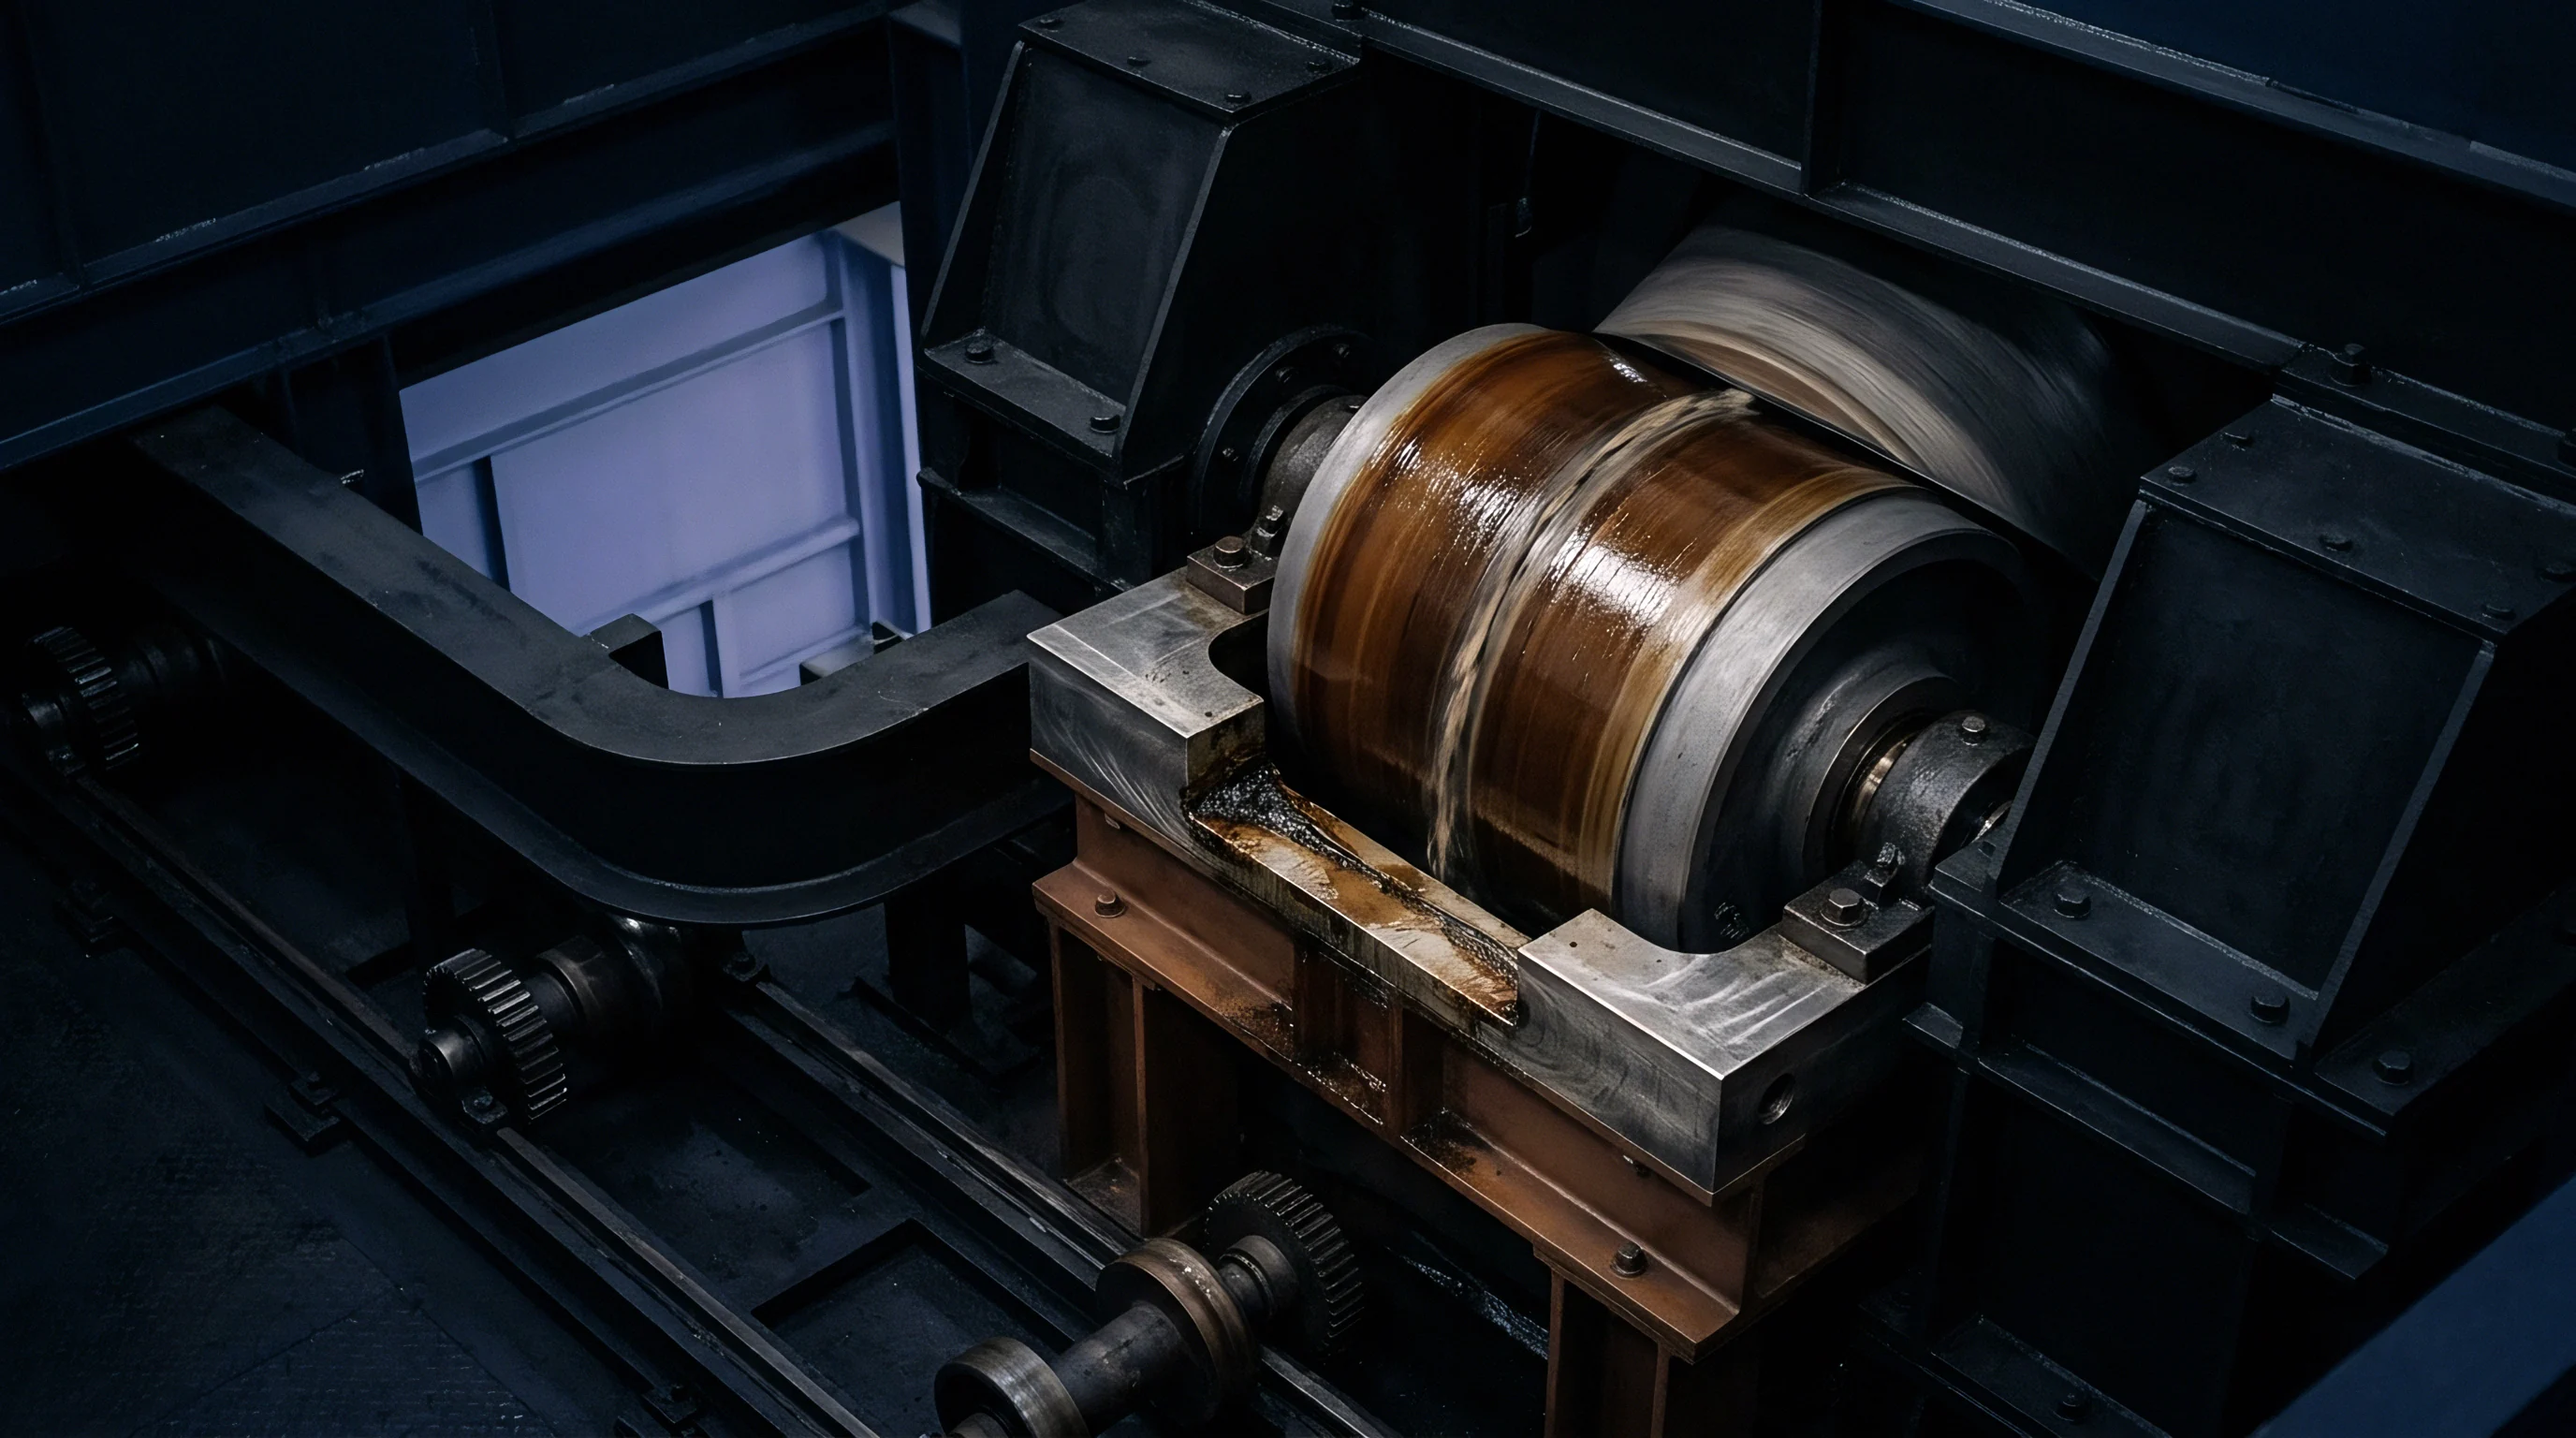

Heat

Viscoelastic Dissipation and Thermal Runaway
Cyclic deformation converts mechanical work into internal thermal energy through hysteresis losses. Polymers possess high internal loss moduli and poor bulk thermal conductivity, typically between 0.15 and 0.35 Watts per meter-Kelvin. Dissipated mechanical strain energy accumulates within the specimen interior faster than boundary convection dissipates it.
This internal energy storage triggers local thermal runaway long before mechanical fatigue cracks coalesce into a fracture surface.
Test frequencies dictate the balance between hysteretic thermal buildup and mechanical micro-damage. High test frequencies compress cycle acquisition time while introducing self-heating artifacts that invalidate raw endurance data. Frequencies above two Hertz frequently produce artificial thermal melting failures in unreinforced resins loaded above thirty percent of their static yield.
Accurate mechanical derating requires separating pure thermal softening from true cyclic microstructural damage.
Active surface thermography isolates the transition point between steady-state conduction and thermal accumulation. Contact thermocouples and infrared pyrometers monitor specimen gage sections under load. When dissipation rates exceed the external heat transfer coefficient, specimen surface temperatures climb continuously until stiffness loss precipitates structural collapse.
Surface temperatures level off into a flat plateau when cyclic frequencies remain sufficiently low.
- Mechanical work dissipation generates heat inside the core volume as the viscous component of the complex dynamic modulus lags applied stress cycles.
- Thermal accumulation elevates the internal temperature field above ambient setpoints, lowering the local dynamic storage modulus.
- Strain amplitude escalation occurs under load-controlled cycling as specimen compliance grows, generating even greater hysteretic energy per cycle.
- Premature yield rupture terminates the component life through macroscopic softening rather than mechanical crack propagation.
Specimen geometry alters thermal dissipation pathways significantly. Thick-walled components trap hysteretic energy within their bulk centers, developing core temperatures twenty to forty degrees Celsius hotter than external surface layers. Thin flexural specimens exchange thermal energy rapidly with surrounding atmospheres, postponing internal thermal acceleration.
Derating factors derived from thin flat specimens will overestimate thick-walled structural component lifespans unless adjusted for wall thickness through transient conduction equations.
Failure to correct fatigue deratings for internal hysteretic temperature rise produces catastrophic structural yields thousands of operational hours before nominal service limits elapse.

Shift

Time-Temperature Superposition and Equivalency Functions
Viscoelastic relaxation phenomena link loading frequency and operating temperature through equivalent kinetic states. Applying the Williams-Landel-Ferry equation allows test programs to extrapolate low-frequency, high-temperature fatigue responses from accelerated bench data collected at reduced temperatures. This empirical equivalence functions reliably throughout the transition zone from the glass transition temperature up to fifty degrees Celsius above it.
Universal WLF constants often introduce systematic errors into fatigue derivations, demanding material-specific parameter generation via dynamic mechanical analysis.
Dynamic mechanical thermal analysis measures storage modulus, loss modulus, and loss factor across frequency and temperature spectra. The resulting master curves define horizontal shift factors along the temporal axis. For operating regimes positioned deeply below the glass transition, Arrhenius activation formulations describe the shift dynamics with superior precision, anchoring the shift to relaxation of localized secondary polymer chain segments.
Viscoelastic shift calculations break down the instant local cyclic stresses induce micro-yielding or internal crazing.
Fatigue life equations scale stress amplitude against cycle counts using logarithmic degradation slopes. When constructing an Arrhenius shift for high-cycle fatigue, the apparent activation energy reflects the energetic cost of chain slippage and micro-void coalescence. Glass-filled polyamides, for example, exhibit distinct apparent activation energies below and above their glass transition.
Using an unsegmented single activation energy across an expansive temperature range distorts the projected derating factor.
| Polymer Formulation | Glass Transition (C) | Arrhenius Sub-Tg Activation (kJ/mol) | WLF C1 Parameter | WLF C2 Parameter (K) |
|---|---|---|---|---|
| Polyphthalamide 35% GF | 125 | 145 | 16.2 | 48.5 |
| PPS 40% Glass Reinforced | 90 | 185 | 17.4 | 52.1 |
| POM Homopolymer Extruded | -45 | 85 | 14.8 | 55.0 |
| PEEK 30% Carbon Fiber | 147 | 210 | 15.8 | 46.2 |
Mathematical master curves assume linear viscoelasticity across all test points. Polymer fatigue by its nature operates within nonlinear, micro-plastic regimes at high stress amplitudes. Direct application of time-temperature superposition to mechanical fatigue requires validation against empirical fatigue points obtained at real target temperatures.
Master curves provide a screening framework, while physical test verification settles final design numbers.
The raw resin supplier catalog guarantees that master curve shifts derived from low-strain dynamic mechanical analysis predict mechanical fatigue life across all thermal regimes without supplemental empirical testing.

Coupling

Environmental Ingress and Mean Stress Interactions
Thermal degradation rarely acts as an isolated variable during real service exposures. Ambient moisture ingresses into polar engineering resins like nylon 6 and nylon 66, lowering the effective glass transition temperature through molecular plasticization. Equilibrium moisture absorption of eight percent in water-conditioned PA6 drops its glass transition from seventy degrees Celsius down to minus ten degrees Celsius.
This shifts the polymer from a glassy state into a rubbery state at standard room temperature, altering fatigue derating curves completely.
Mean stress ratios, denoted as R, amplify the thermal sensitivity of engineering polymers. Positive mean stresses accelerate chain disentanglement, promoting ratcheting and cyclic creep strain accumulation alongside alternating mechanical fatigue damage. S-N curves constructed at an R ratio of minus one reflect pure fully reversed fatigue.
Curves generated at an R ratio of zero point one incorporate sustained mean tensile stresses that open voids and accelerate internal thermal degradation.
Continuous thermal exposure also triggers chemical degradation pathways. Thermo-oxidative aging severs backbone polymer chains, inducing surface embrittlement and micro-cracking under cyclic loading. Elevated temperatures speed oxygen diffusion into resin matrices, reducing molecular weight in the outer boundary layers.
Once embrittled surface skins form, cracks initiate at fractions of the fatigue threshold observed in pristine, unoxidized specimens.
- Equilibrium moisture conditioning drives the glass transition temperature downward, turning ambient thermal baselines into rubbery degradation regimes.
- R-ratio escalation toward unity converts cyclic fatigue damage into combined cyclic creep and directional strain accumulation.
- Anisotropic fiber distribution concentrates tensile loads along flow paths, leaving cross-flow planes vulnerable to thermal matrix shearing.
- Thermo-oxidative embrittlement corrodes outer boundary layers, forming surface stress concentrations that accelerate mechanical crack propagation.
Fiber orientation patterns established during injection molding alter thermal derating margins across mechanical axes. Longitudinal fiber orientations shield the polymer matrix by carrying tensile vectors directly along the fiber axis. Transverse orientations force loads through the unreinforced matrix, causing fatigue strength to fall off rapidly as temperatures climb toward the matrix softening point.
Derating factors derived from longitudinal mold-flow coupons cannot protect transverse load paths.
Coupled environmental exposure accelerates polymer fatigue damage faster than uncoupled single-variable test baselines predict.
A molded nylon component operating above its conditioned glass transition demands continuous assessment of moisture content alongside thermal cycling to track shifting mechanical thresholds.


Margin

Knockdown Synthesis and Qualification Dossiers
Engineering sign-off for load-bearing polymer components requires aggregating discrete environmental derating factors into a unified fatigue knockdown factor. Analysts derive this total factor by multiplying the base temperature derating coefficient, the mean stress correction, the environmental aging coefficient, and the manufacturing process variance. The resulting design allowable sets the peak permissible alternating stress amplitude for target operational lifespans.
Oversizing components to offset unverified deratings wastes resin mass, increases cycle times, and inflates raw material costs.
Consider an injection-molded automotive bracket manufactured from thirty percent glass-filled polybutylene terephthalate. The baseline room temperature fatigue strength at ten million cycles equals eighty-two megapascals under tension-tension loading at R equals zero point one. The application environment runs at ninety degrees Celsius within an under-hood enclosure.
Laboratory data establishes a pure thermal derating factor of zero point forty-nine for this thermal threshold.
Accounting for localized injection knit lines requires a structural factor of zero point eighty-five, while long-term engine oil exposure introduces a chemical degradation factor of zero point ninety. The composite derating factor is calculated by sequential multiplication across these discrete risk vectors. Multiplying zero point forty-nine by zero point eighty-five and zero point ninety yields a final knockdown multiplier of zero point thirty-seven.
The permissible design fatigue stress for ten million cycles falls from eighty-two megapascals down to thirty point three megapascals.
Engineering qualification dossiers assemble this testing pedigree into an auditable document. The dossier must contain raw S-N curves, dynamic mechanical spectra, specimen thermography traces, fiber alignment maps, and chemical exposure logs. Without complete documentation of specimen conditioning and thermal dissipation boundaries, structural sign-offs remain defenseless during product integrity audits.
What safety margin balances the commercial cost of testing multi-decade fatigue exposure against the legal liability of structural component failure in dynamic applications?