Triage Principles for Manufacturing Quality Management Logs
Triage quality logs by immediate containment risk and throughput impact to clear shift backlogs and isolate critical assembly line defects.


Filter
Manufacturing operations processing five thousand automated inspection events per shift run into severe data congestion when raw exception entries accumulate without immediate risk ranking. High-speed assembly lines generate continuous streams of photoelectric sensor readings, vision system flags, torque angle deviations, and manual operator notices. Without filtering, these entries land in a single chronological queue, quickly paralyzing engineering capacity.
When quality engineers evaluate minor paint blemishes with the same priority as structural weld failures, triage latency climbs across all production lines.
Establishing operational control begins right at the primary data intake boundary. Quality management logs demand immediate classification based on containment latency, safety criticality, and potential throughput disruption. Because queue depth dictates containment speed, sorting raw exception records within seconds of occurrence prevents unverified parts from advancing down the assembly sequence.

Immediate Non Conformance Classification Workflow
Quality control teams handle raw event records by establishing an immediate sorting threshold at the primary data intake. The classification system categorizes incoming event logs into four distinct operational risk bands, each dictating specific automated or manual responses.
| Risk Severity Band | Signal Criteria and Defect Type | Target Triage Latency | Mandatory Action and Containment Rule |
|---|---|---|---|
| Band 1: Critical Safety | Automated vision failure on structural joints, brake system torque failure, high-voltage isolation fault | Under 30 seconds | Automated line stop, immediate station lockout, physical part ejection |
| Band 2: Functional Escape | Dimensional drift beyond 75% tolerance limit, sub-component alignment error, missing internal fastener | Under 15 minutes | Buffer inventory freeze, shift supervisor notification, 100% manual re-inspection |
| Band 3: Minor Non-Conformance | Surface scratch below cosmetic specification, minor flash on non-mating cast edge, barcode readability warning | End of shift | Automated tracking log entry, supplier reporting batch accumulation, standard disposition review |
| Band 4: Sensor Telemetry Noise | Optical sensor glare spike, ambient temperature shift notification, transient voltage fluctuation | Real-time auto-clear | Automated system filtering, background logging, maintenance trend aggregation |
Automated sorting algorithms evaluate machine telemetry alongside manual inspector entries to assign these risk bands instantaneously. Band 1 events trigger electronic interlocks on downstream conveyor systems, forcing physical containment before human intervention occurs. Band 2 events allow limited buffer movement while establishing an electronic hold on the affected batch within the enterprise warehouse system.
An automated inspection logging rate exceeding forty events per minute causes manual triage latency to surge past two hours per shift.
Managing high-volume quality logs without automated risk band filtering degrades overall plant effectiveness. When quality engineering teams spend shifts sifting through false optical alarms, genuine functional defects escape into final vehicle testing or customer shipments. Linear triage workflows simply fail as volume expands.
Failing to categorize raw log entries at the intake boundary causes minor process drift to masquerade as severe equipment failure, exhausting engineering labor on trivial adjustments while true structural non-conformances advance unhindered to downstream assembly.


Taxonomy
Categorizing manufacturing quality records requires clear boundaries between physical material failures, tooling degradation, and electronic measurement anomalies. Raw inspection records often combine distinct root failure modes under generic error codes, while sensor drift distorts inspection readings. Without detailed categorization standards, quality management logs obscure actionable trends under ambiguous descriptions such as out of spec or mechanical fault.
A functional logging structure separates the observational symptom from the verified physical mechanism, giving raw data the severity context it otherwise lacks. When operators log a failed press-fit operation, the entry must distinguish between insufficient interference fit caused by component dimensional variance and press ram position error caused by hydraulic line pressure drops.

Distinguishing Sensor Noise from Line Escapes
Inspection systems often generate false alarms due to optical contamination, thermal drift, or transient electrical interference on the line. Quality engineering teams must isolate telemetry artifacts from genuine physical material non-conformances, knowing that latent defects compound down line steps. Differentiating false positive signals from true material defects protects line speed while maintaining absolute quality containment.
- Dimensional Variance Logs record deviation from nominal geometry exceeding fifty percent of drawing tolerance limits.
- Calibrated Equipment Drift Alerts capture progressive sensor offset during continuous thermal cycling across operational shifts.
- Cosmetic Surface Exception Entries report visual blemishes that do not impair mechanical function or structural integrity.
- Critical Safety Fit Failures indicate interference fit mismatches that halt downstream automated joining cells immediately.
Establishing clear log entry definitions allows quality managers to audit failure frequencies accurately across parallel assembly shifts. Standardized nomenclature ensures that an error logged on line one matches the diagnostic criteria used on line three.
Raw non-conformance logs record surface symptoms without identifying the underlying physical mechanism of failure.
Systematic classification prevents recurring machine faults from hiding behind disparate log descriptions written by individual operators. When log taxonomy is enforced at the user interface level, data aggregation algorithms identify systemic tooling wear three shifts before catastrophic component failure occurs.
Automated logging software often generates excessive false positive notifications, inflating recorded non-conformance rates during incoming material audits.

Quarantine
Material isolation protocols freeze physical inventory movement the moment a Band 1 or Band 2 log entry receives confirmation from the triage desk. Digital quality management logs must link directly to programmable logic controllers and automated guided vehicles across the factory floor, as unsegregated lots generate high scrap. A failure to execute instant physical containment converts a minor quality log entry into a plant-wide scrap event.
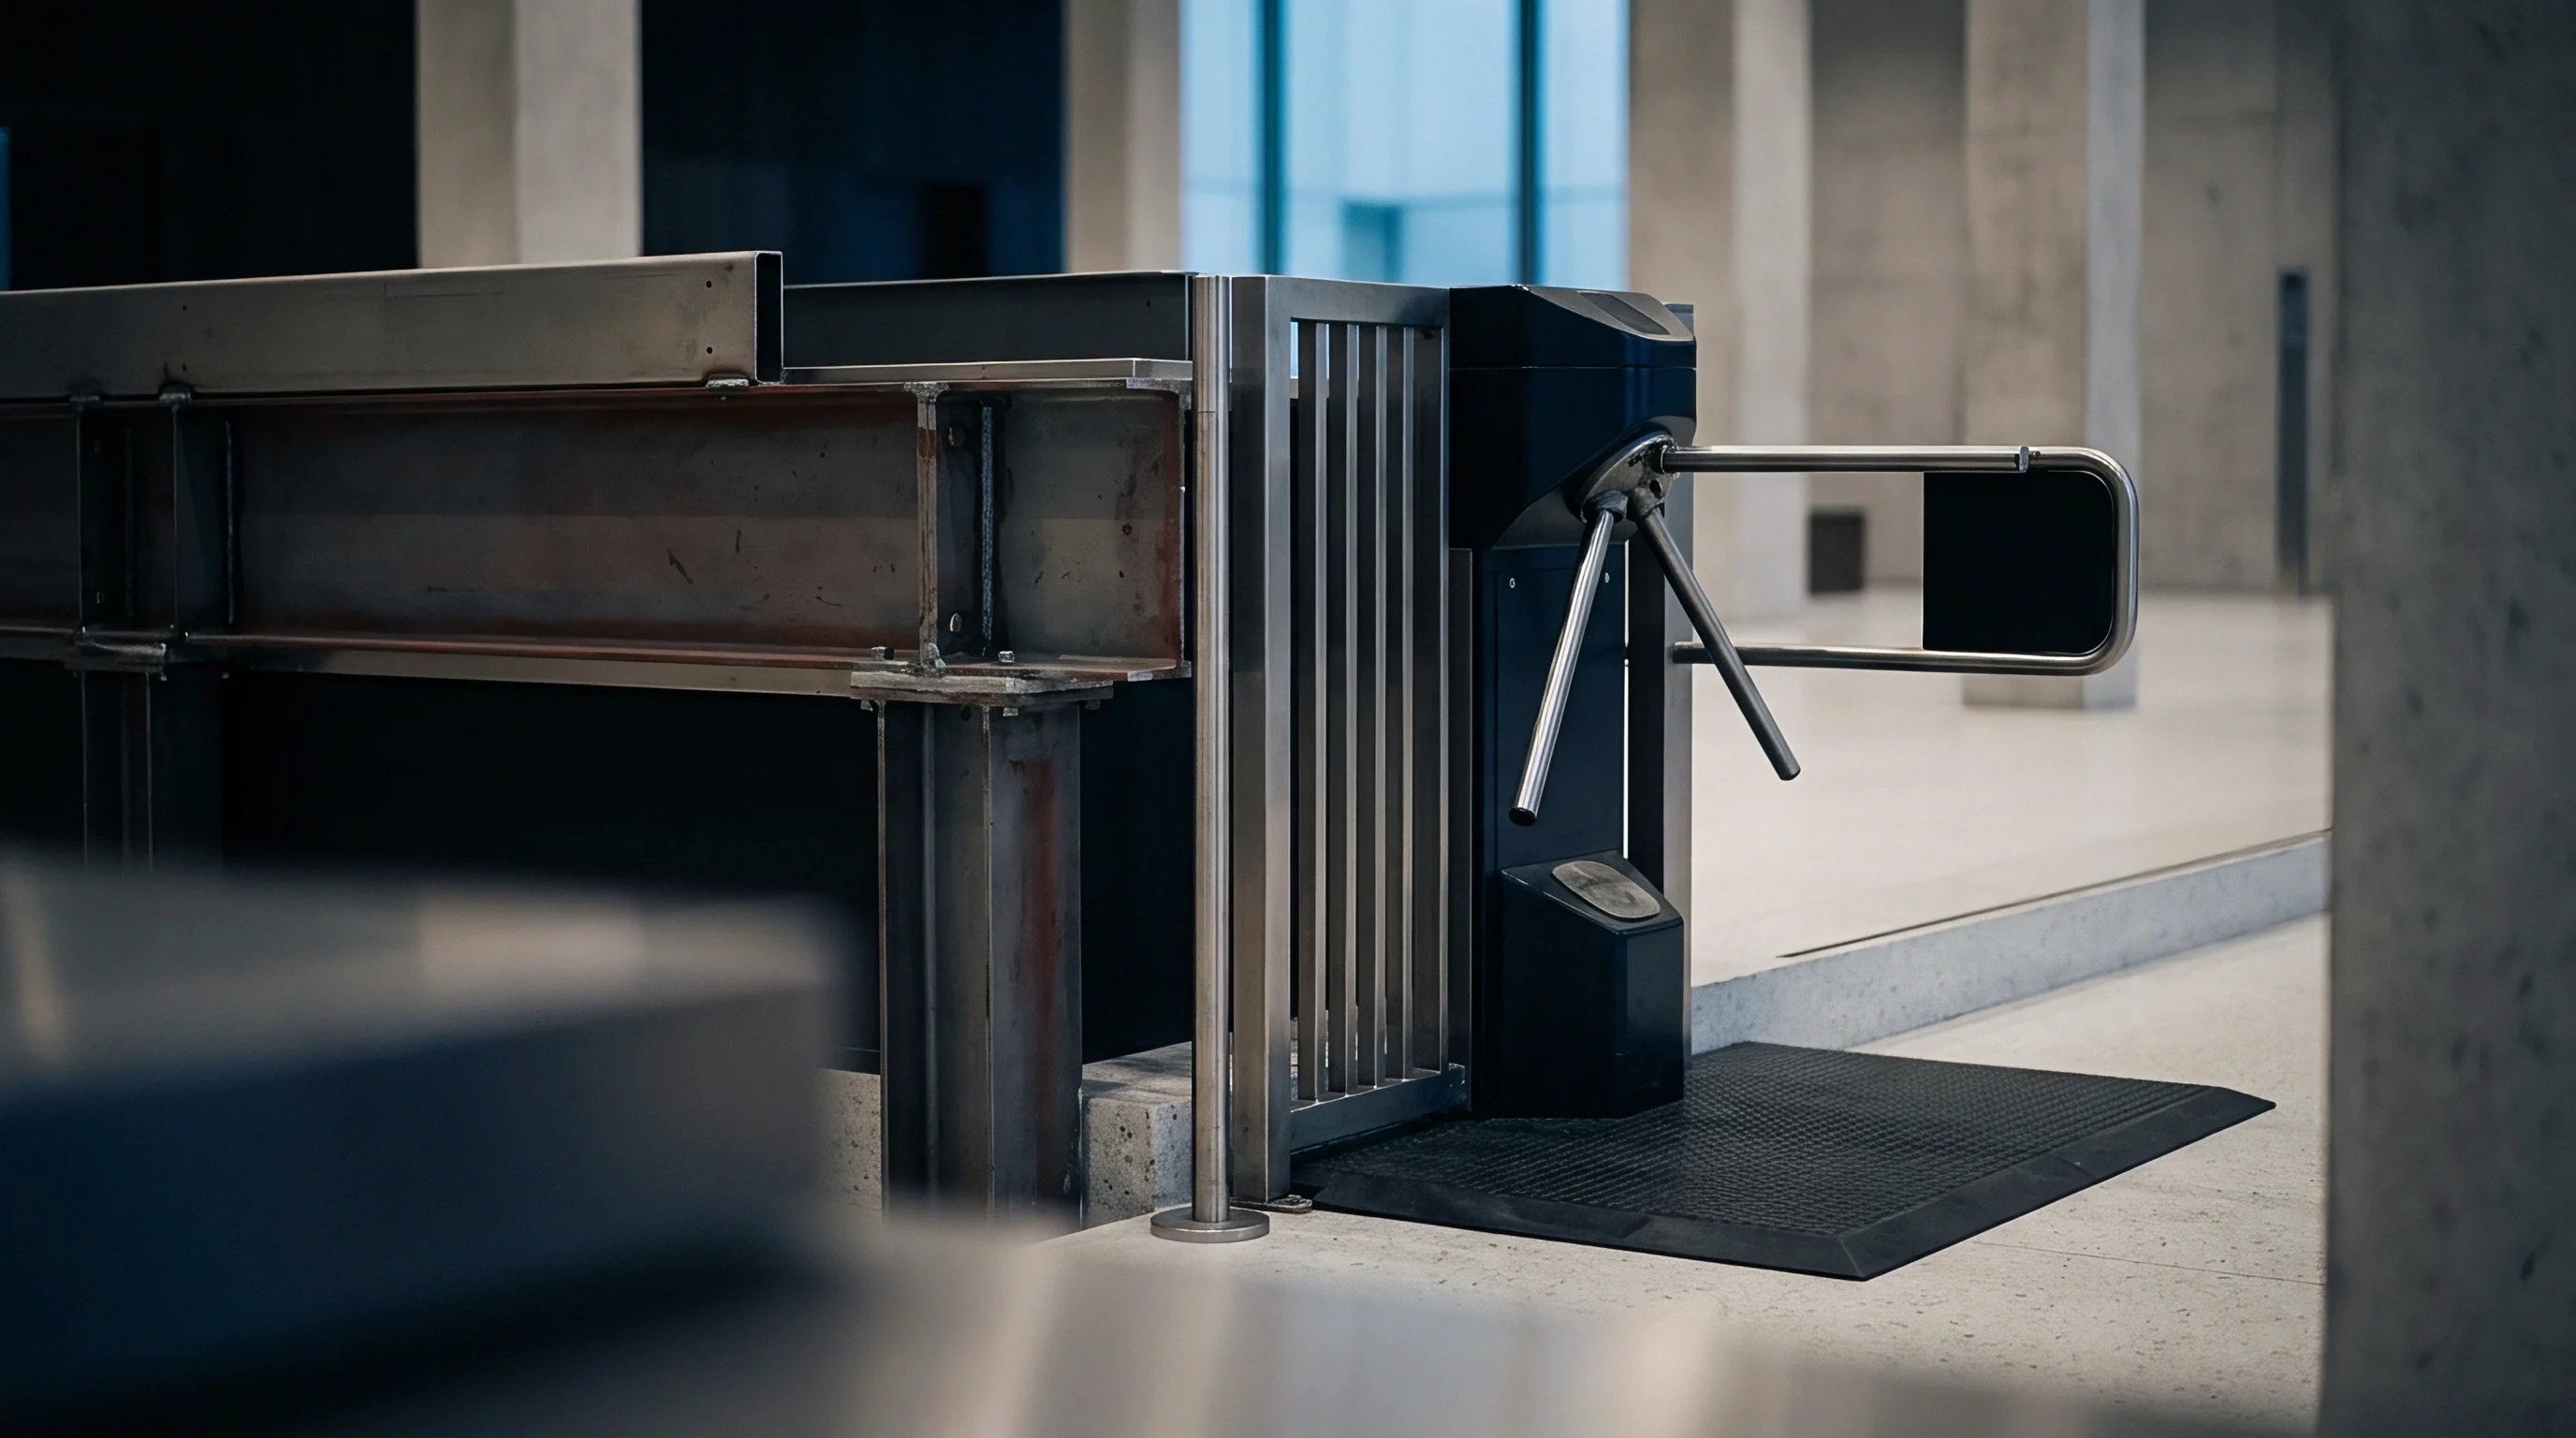
Effective quarantine mechanics operate simultaneously across digital control layers and physical shop floor space to protect downstream assembly. Upon log validation, automated material handling systems reroute suspect pallets into secure physical storage cages equipped with electronic access gates.

Stepwise Isolation and Containment Mechanics
Halting suspect lot progression prevents non-conforming sub-assemblies from entering downstream automated cells, ensuring containment precedes corrective action execution. Production managers execute isolation procedures following a strict five-step operational sequence.
- The shift supervisor halts downstream transfer of the suspect production lot upon receiving log alert validation.
- Inventory controllers tag the physical pallets with red material hold markers and assign digital quarantine status in the enterprise resource system.
- Quality technicians pull five random samples from the batch for full coordinate measuring machine dimensional verification.
- Process engineers inspect tooling fixtures for wear, thermal expansion, or mechanical misalignment causing out-of-tolerance features.
- The plant manager approves lot disposition based on empirical re-inspection results recorded in the permanent log.
The isolation workflow locks the affected inventory in the warehouse control software, preventing shipping dock personnel from generating bill of lading documentation for quarantined material. Digital hold flags override manual dispatch commands.
| Containment Level | Trigger Log Severity | Physical Control Mechanism | Historical Defect Escape Rate |
|---|---|---|---|
| Level 1: Station Lockout | Band 1 Safety Defect | Automated PLC conveyor stop, mechanical pallet clamp engagement | 0.01% |
| Level 2: Batch Quarantine | Band 2 Functional Drift | Automated guided vehicle reroute to locked storage cage | 0.12% |
| Level 3: Buffer Freeze | Accumulated Band 3 Logs | Software inventory transfer lock in enterprise resource planning system | 1.45% |
| Level 4: Visual Tagging | Manual Operator Alert | Physical red hold tag placement by quality inspector | 4.80% |
| Historical escape rates compiled across 1.2 million component transfers under standard ISO 9001 auditing conditions. Level 4 controls exhibit higher escape rates due to reliance on human visual adherence without automated software interlocks. | |||
Integrating physical containment cages with automated logging systems eliminates human error during high-stress production runs. When containment actions rely entirely on manual floor tagging, material handler oversight leads to quarantined lots being loaded into downstream assembly cells.
ISO 9001:2015 Clause 8.7.1 obligates organizations to ensure that output which does not conform to requirements is identified and controlled to prevent unintended use.
Rigid quarantine workflows protect both customer delivery quality and plant operating margins. Automated containment verification ensures that no quarantined part bypasses inspection checkpoints, safeguarding overall factory yield metrics.
Compliance with IATF 16949 Section 8.7.1.1 transforms informal verbal hold requests into documented containment actions that bind both internal production managers and tier-one component suppliers.


Ledger
Documenting quality triage decisions establishes an immutable historical record necessary for regulatory compliance and root cause problem solving. Quality management systems rely on verified data logs to establish material traceability across complex supply chains, where unclosed records expose shift operations. Omitting operator credentials or timestamp detail renders quality logs defenseless during external regulatory audits.
Maintaining high-integrity quality ledgers requires strict electronic controls over data entry fields, modification histories, and disposition approvals, since data gaps break chain custody. Digital ledger systems reject incomplete records, forcing inspectors to complete all mandatory fields before closing a triage ticket.
Audit Verification of Inspection Log Integrity
Third-party quality assessors scrutinize entry timestamps and supervisor sign-offs to confirm strict adherence to operating procedures, knowing that resolution lag increases warranty exposure. Complete audit trails prove that non-conforming materials received proper disposition prior to product shipment.
- Timestamp Synchronization matches physical part processing times against automated defect detection timestamps within a one-second tolerance.
- Operator Attributability Credentials verify that every manual log triage decision links to a uniquely identified level-two quality inspector.
- Root Cause Linkage Code binds individual defect log entries to corresponding 8D corrective action reports in the central database.
- Disposition Sign Off Stamp records final engineering authorization before releasing quarantined inventory back to active line status.
Digital ledgers store historical non-conformance records in read-only formats protected by cryptographic checksums. This structure prevents retroactive alteration of defect severity ratings or disposition sign-off dates following field quality incidents.
A quality log entry without an attributed disposition approval remains an open compliance liability during third-party audits.
Maintaining complete documentation coherence between raw shop floor logs and final engineering change orders ensures long-term process accountability. Auditable logs allow engineers to trace field failures back to the specific shift, machine, and material lot that generated the initial exception entry.
An unverified quality log entry provides zero protection against product liability claims when failure documentation lacks clear engineering sign-off.


Velocity
Scaling plant throughput while managing a growing backlog of unassigned quality records creates compounding operational risk, as volume masks root causes. When assembly lines accelerate without a proportional increase in triage velocity, unresolved non-conformance logs accumulate in quality management queues. Unclosed tickets create blind spots that obscure rising defect rates until scrap costs escalate dramatically.
Triage throughput metrics directly govern plant expansion readiness, since inventory turns drop during holds. A facility attempting to double shift output while maintaining a forty-eight-hour log resolution backlog will experience severe bottlenecking at quality containment stations.

What Dynamic Threshold Governs Escalation Gates?
Plant leadership determines expansion readiness by tracking the resolution rate of high-priority non-conformance records against shift volume targets, because capacity gates require clean records. When triage resolution lag exceeds defined operational boundaries, capacity expansion gates lock automatically, preventing line speed increases until backlogs clear.
| Production Ramp Stage | Max Unresolved Band 1/2 Logs | Mean Time to Triage Target | Gating Condition for Line Speed Escalation |
|---|---|---|---|
| Pilot Scale (20% Rated Volume) | Zero open entries | Under 5 minutes | 100% root cause closure on all historical prototype exception logs |
| Ramp Phase (50% Rated Volume) | Under 3 entries per shift | Under 10 minutes | Triage clearing velocity exceeds log generation rate by 25% |
| Full Volume (100% Rated Volume) | Under 5 entries per shift | Under 15 minutes | Zero overdue Band 1 corrective action tickets exceeding 24 hours |
| Over-Capacity (120% Rated Volume) | Zero open entries exceeding 1 shift | Under 5 minutes | Automated triage coverage active on 98% of machine telemetry logs |
Evaluating triage velocity requires comparing log clearing rates against incoming defect volume across consecutive shifts. Consider a plant operating at forty units per hour that generates twelve Band 2 quality log entries per shift. If the quality engineering team clears only eight log entries per shift, the unresolved log queue expands by four tickets every eight hours.
Within five operating days, sixty unreviewed non-conformance tickets accumulate in the system.
This accumulation increases the risk of holding non-conforming inventory in active assembly buffers. If line speed increases to sixty units per hour without resolving the triage bottleneck, log generation surges to eighteen entries per shift, accelerating backlog growth and leading to unauthorized lot releases or line shutdowns.
Plant executives face an unresolved question when considering whether scaling line speed from forty to sixty units per hour without resolving the forty-eight-hour triage log backlog creates a permanent scrap multiplier across peak operating shifts.