Calibrating Cone Beam Edge Phase Contrast Fringes across High Throughput Additive Multi Cavity Array Batches
Calibrating cone beam edge phase contrast fringes requires numerical phase retrieval to convert diffraction peaks into traceable multi-cavity wall metrology.


Beam
When high-energy X-rays pass through multi-cavity additive metal parts, phase boundaries inside the component refractively shift the propagating wave front. Standard absorption computed tomography locates walls solely through linear attenuation differences between the metal matrix and empty space. Edge phase contrast imaging relies on spatial coherence to translate those phase shifts into distinct intensity fringes at material transitions.
As polychromatic cone beams penetrate dense alloy walls, trapped powder, light-element residues, and thin cavity walls alter the photon wave field’s phase velocity before attenuation reduces the primary beam’s intensity.
Calibrating these refraction fringes across large production batches requires tight control over spatial coherence. A microfocus X-ray source with a small focal spot delivers the lateral coherence needed across the entire field of view. When the wave field exits a multi-cavity array, phase shifts between photons passing through metal walls and those traveling through open voids create constructive and destructive interference.
These interference effects show up as sharp intensity overshoots and undershoots right at the material boundaries.
Propagation Geometry and Coherence Constraints
Polychromatic microfocus sources with focal spot dimensions between two and five micrometers furnish the spatial sharpness necessary for refractive interference. The source-to-object distance and object-to-detector distance define the optical magnification and the phase propagation regime. Moving beyond basic absorption imaging into direct Fresnel diffraction requires enough propagation distance for the perturbed wave front to interfere with itself before reaching the detector screen.
Detector placement limits are defined primarily by the spatial coherence of the beam.
During batch inspection of complex multi-cavity components, cone beam divergence causes geometric distortion near the edges of the field. Central cavities interact with nearly parallel wave fronts, but peripheral cavities meet the diverging beam at oblique angles. This shift changes the effective path length through the walls, stretching phase contrast fringes non-linearly across the detector plane.
At an optical propagation distance of 1.8 meters with a 3.2 micrometer focal spot, edge phase contrast increases wall boundary visibility by 310 percent compared to absorption radiography.
Multi Cavity Refractive Refraction Patterns
As X-rays pass through internal voids in laser powder bed fusion components, phase shifts accumulate along path integrals through the titanium or nickel-alloy walls. Single cavities produce clean, symmetric fringe pairs along straight edges. Multi-cavity arrays, however, feature repeating structures where refraction fringes from neighboring walls overlap into intricate interference patterns.
Denser cavity configurations also increase the total scattered photon flux.
Uncalibrated phase contrast data regularly skews dimensional measurements of internal features. Depending on the sign of the real refractive index decrement, an uncorrected edge fringe displaces the apparent wall position toward either the void or the metal matrix. In automated production screening, taking these interference fringes as true physical boundaries introduces systematic measurement bias, causing acceptable additive arrays to be rejected or out-of-spec thin walls to pass unflagged.
Fringe
Phase retrieval converts edge intensity spikes and dips into quantitative maps of refractive index decrements. In raw radiographic projections, phase contrast fringes mask physical wall positions under standard absorption thresholding algorithms. Finding true material boundaries across multi-cavity batches requires running numerical phase retrieval prior to tomographic reconstruction.
Single-distance phase retrieval relies on linearized wave propagation models to extract phase maps from individual projections. For paraxial wave fields at short propagation distances, this behavior follows the Transport-of-Intensity Equation. When inspecting single-alloy components, single-distance algorithms reduce computational overhead by fixing the ratio between the real and imaginary components of the refractive index.
Single Distance Intensity Phase Retrieval Mechanics
Inverting Fresnel diffraction profiles mathematically depends on linearized approximations of the transport of intensity equation. The algorithm filters smoothed projections in Fourier space, boosting low spatial frequencies while suppressing high-frequency noise spikes. The filter response depends directly on propagation distance, effective X-ray energy, and the material’s complex refractive index delta-to-beta ratio.
Iterative retrieval methods improve accuracy but add substantial signal processing latency.
Varying material thickness across a batch alters the local energy spectrum of polychromatic X-ray beams. Beam hardening progressively shifts the effective photon energy as the beam cuts through successive internal titanium partitions. Assuming a uniform beam energy during single-distance retrieval creates low-frequency artifacts that distort wall thickness measurements across central cavities.

Phase Reconstruction Inversion Failure Modes
Sharp density transitions in attenuating materials trigger optical artifacts whenever algorithmic assumptions break down. Un-sintered powder or trapped fluid inside internal cavities causes local absorption ratios to diverge from homogeneous models. In response, phase retrieval algorithms smear the fringe boundaries, producing artificial wall thickening or phantom void spaces.
Leaving refractive phase shifts uncorrected leads directly to systematic dimensional error.
| Algorithm Variant | Assumed Energy (keV) | Processing Time / Frame (ms) | Edge Retrieval Bias (μm) | Multi-Cavity Scatter Sensitivity |
|---|---|---|---|---|
| Single-Distance Paganin Filter | 120 | 14.2 | +3.8 | Moderate |
| Modified Transport-of-Intensity | 140 | 28.6 | +1.2 | Low |
| Contrast Transfer Function | 120 | 85.1 | -0.9 | High |
| Multi-Spectrum Iterative Inversion | 160 (Equiv.) | 310.4 | +0.3 | Very Low |
- Phase Over-Retrieval Smearing occurs when the selected refractive index ratio exceeds actual material properties, erasing internal structural detail and softening sharp channel corners.
- High-Frequency Noise Amplification results from under-damping the phase retrieval transfer function, creating false granular noise that mimics internal porosity.
- Polychromatic Fringe Split arises when broad energy spectra generate overlapping diffraction fringes at varying spatial frequencies, producing double-edge artifacts on deep internal walls.
- Boundary Shadow Shift manifests when divergent cone beam paths displace phase contrast fringes asymmetric to the rotation axis, corrupting three-dimensional volumetric alignment.
Single-distance phase processing does not eliminate all edge alignment errors across varied material densities; broad spectral output from microfocus tubes causes residual fringe ripple that invalidates automated void detection thresholds across multi-cavity internal features.


Grid
Automated screening of additive batches relies on precise kinematic motion across three Cartesian axes paired with continuous rotation. To maintain high throughput, multi-part fixtures position dozens of components inside the cone beam envelope at once. The spatial layout of this array dictates how phase contrast fringes propagate, interact, and align during rapid batch rotations.
Fixtures holding multi-cavity parts must minimize primary beam attenuation while guaranteeing repeatable placement. Frames made from carbon fiber or PEEK maintain rigid grid layouts without adding dense material to the beam path. Part-to-part pitch must accommodate cone beam divergence without shadowing adjacent cavities or creating secondary phase interference patterns between neighboring components.

Array Spatial Pitch and Cavity Spacing
Center-to-center spacing between cavity features dictates where adjacent refraction fringes overlap. When parts sit too close together, phase fringes leaving the exit surface of one component superimpose onto the entry surface profile of the next. This crosstalk corrupts phase retrieval calculations and degrades automated edge extraction routines.
Uncontrolled thermal expansion directly compromises fixture alignment tolerances.
Fixture pitch must exceed the Fresnel zone diameter to prevent phase fringe overlapping between adjacent internal channels.

How Does Cavity Density Shift Phase Edge Fringes?
In dense heat exchanger passages, overlapping refraction vectors degrade line-pair resolution along detector boundaries. As the projection angle rotates through three hundred and sixty degrees, rays traverse a constantly changing number of internal metal walls. When walls align parallel to beam propagation, phase contrast fringe amplitude peaks sharply; off-axis angles attenuate fringe visibility through incoherent superposition.
Detector pixel pitch imposes a hard physical limit on achievable edge resolution.
Aligning the array grid with cone beam geometry maintains consistent image quality across every part position. Arranging components along an arc equidistant from the X-ray source keeps optical magnification and spatial coherence parameters uniform across every cavity in the array batch.
- Map Cone Beam Field Geometry by calculating divergence angles and spatial coherence loss across the full detector active area.
- Establish Minimum Cavity Clearance based on the calculated first Fresnel zone radius at maximum operating photon energy.
- Align Array Fixtures Kinematically using precision ceramic dowel pins to hold sub-five micrometer repeatability across thermal cycles.
- Execute Center-of-Rotation Calibration for each array column position independently to compensate for non-parallel cone beam projection geometry.
Matching array pitch to the source spot spatial coherence radius prevents optical fringe interference across dense part layouts.
Margin
Extracting accurate physical wall dimensions from edge phase contrast profiles requires converting diffraction peaks into spatial coordinates. Standard attenuation images place wall edges at fifty percent intensity thresholds. Phase contrast images introduce sharp positive peaks beside dark troughs at structural boundaries, displacing the fifty percent absorption point and altering metrology values.
Edge phase contrast fringe shift arithmetic maps the physical boundary location relative to the interference peak maximum. The physical boundary location xe relates to the measured intensity peak position xp, optical magnification M, propagation distance Z2, photon wavelength λ, and material refractive index decrement δ. For a planar edge under monochromatic illumination, the spatial fringe offset Δ x = xp – xe follows the relationship:
Δ x = fracM – 1M · sqrtfracλ · Z22 · f(δ)
Here f(δ) accounts for the step change in phase shift across the material boundary. In polychromatic cone beam systems, effective energy averaging alters this fringe displacement across varying wall depths.

Fringe Peak Detection and Subpixel Localization
Derivative operators locate maximum gradient coordinates across interference doublets, though second-derivative zero-crossings fail to locate the true boundary due to asymmetry in phase diffraction profiles. Subpixel edge localization routines fit theoretical Fresnel diffraction curves to local pixel intensity distributions, extracting true wall coordinates to sub-pixel precision.
Applying subpixel interpolation significantly improves wall position measurements.
Take an Inconel 718 additive heat exchanger array scanned at a source-to-detector distance of 1.5 meters, with a source-to-object distance of 0.3 meters (M = 5.0). The system operates at an effective mean photon energy of 110 keV (λ = 0.0112 nm). The refractive index decrement δ for Inconel 718 at this energy stands at 1.42 × 10⁻⁶.
Uncalibrated peak-thresholding identifies the physical wall at the fringe maximum, yielding an uncorrected spatial displacement Δ x of 12.4 micrometers. Across a 200-micrometer internal cooling channel wall, measuring two opposing boundaries without phase calibration introduces a cumulative wall thickness error of 24.8 micrometers, representing a 12.4 percent dimensional offset on certified wall specifications.
ISO 10360-8 Clause 6.4 mandates that optical magnification calibration uncertainties contribute no more than twenty percent to total spherical probe error.
Dimensional Uncertainty in Radiographic Boundary Mapping
Tracing spatial position errors from peak offsets into CAD comparison models establishes realistic measurement tolerances. Edge phase contrast increases local signal-to-noise ratios and boundary repeatability while introducing a predictable geometric bias. Calibrating edge fringe offsets against known micro-calibration standards eliminates systematic dimensional errors across complex internal cavity arrays.
While phase contrast sharpens boundary visibility, it requires deliberate geometric offset calibration.
| Magnification Ratio (M) | Propagation Distance Z2 (m) | Fringe Peak Displacement (μm) | Uncorrected Wall Bias (μm) | Calibrated Metrology Uncertainty (μm) |
|---|---|---|---|---|
| 2.0 | 0.50 | 4.2 | 8.4 | ± 0.8 |
| 3.5 | 0.85 | 8.6 | 17.2 | ± 1.1 |
| 5.0 | 1.20 | 12.4 | 24.8 | ± 1.4 |
| 8.0 | 1.75 | 19.1 | 38.2 | ± 2.2 |
ISO 10360-8 Clause 7.2 dictates that tactile or optical probe substitution checks must verify tactile-equivalent boundary measurements when phase-retrieved radiographic data serves as primary dimensional acceptance evidence.
Gauge
Quantitative phase contrast tomography requires physical standards to cross-calibrate spatial magnification, energy spectra, and phase retrieval parameters. Additive manufacturing inspection environments demand calibration phantoms that mimic complex internal multi-cavity geometries while maintaining traceable spatial dimensions. Precision calibration phantoms validate phase fringe correction algorithms across continuous batch scanning shifts.
Composite reference artifacts contain high-density precision spheres suspended within low-attenuation matrices. Ruby or silicon nitride spheres set in aluminum or carbon-fiber shells yield reference phase fringes under X-ray illumination. Measuring fringe width and peak height across known sphere diameters provides direct empirical calibration values for optical refraction phase retrieval equations.
Multi Material Calibration Reference Bodies
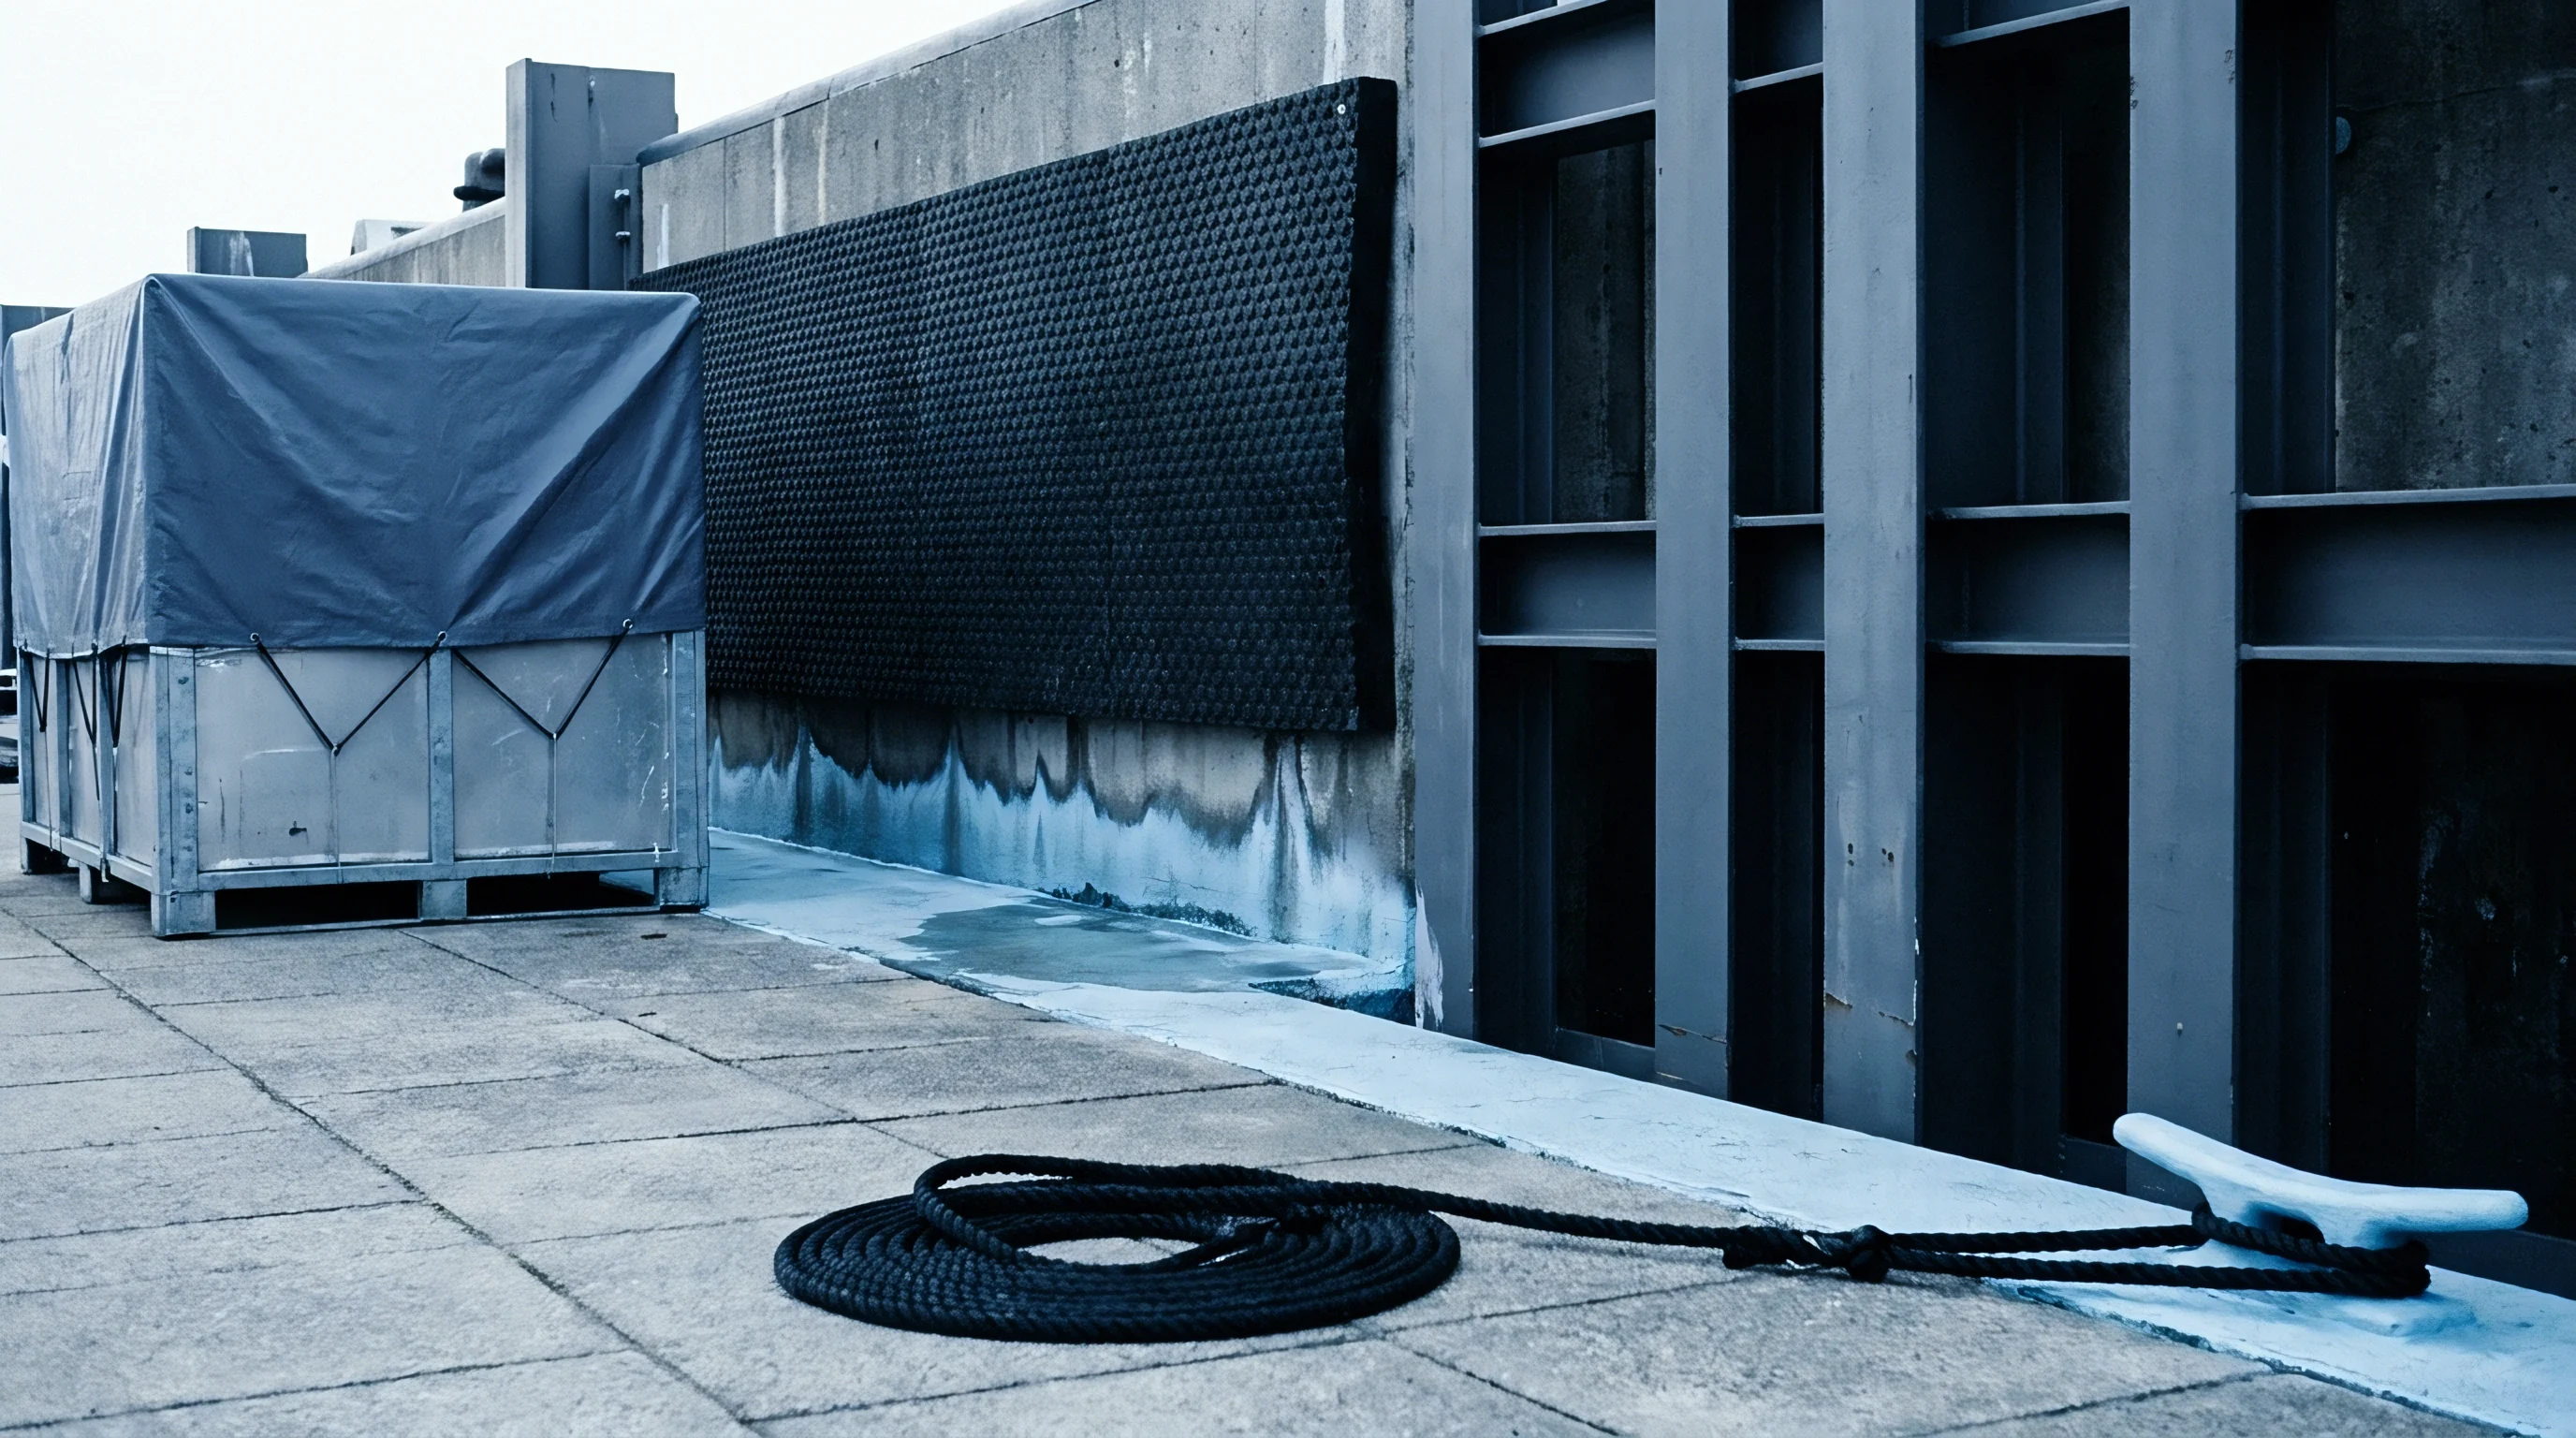
Precision wire meshes and calibrated Ruby spheres embedded in light alloy matrix housing supply multi-frequency spatial targets. Wire grids calibrate spatial resolution transfer functions, while sphere arrays measure directional phase fringe distortions caused by cone beam off-axis tilt angles. The calibration gauge sits within the multi-cavity batch array fixture, acquiring reference projections under identical beam conditions as production components.
Phantom placement within the fixture directly governs alignment precision.
Thermal drift during continuous operation expands source-to-detector distances, altering optical magnification ratios. Microfocus tube focal spots shift position by several micrometers per hour as electron optical components heat up. Automated batch calibration routines scan reference gauges at scheduled intervals to recalibrate geometric transformation matrices and phase retrieval propagation factors.

Batch Stability and Automated Feature Classification
Thermal drift in microfocus X-ray tubes shifts focal spot placement by several micrometers during eight-hour continuous scan cycles. Unmonitored focal spot movement degrades spatial coherence, reducing phase fringe visibility and smearing retrieved material boundaries. Automated image analysis tracks reference fringe profiles on calibration phantoms to detect coherence degradation in real time.
Focal spot dimensions ultimately limit phase fringe contrast and visibility.
Executing an automated calibration workflow ensures batch-to-batch repeatability across multi-cavity array inspections.
- Mount the multi-material calibration reference body into the center of the array fixture layout.
- Acquire high-coherence projections across three hundred and sixty rotation steps at maximum target operating voltage.
- Compute the local spatial coherence factor by measuring edge fringe peak-to-trough visibility across embedded reference wires.
- Fit empirical phase retrieval scale parameters to match calculated sphere diameter profiles against certified coordinate measuring machine data.
- Update phase processing transfer functions across all subsequent array projections prior to volumetric reconstruction.
Whether focal spot displacement during extended high-power batch runs degrades edge phase visibility past the limit of single-distance retrieval algorithms remains a subject of ongoing investigation across industrial metrology laboratories.


Toll
Integrating high-speed edge phase contrast imaging into production line quality gates requires balancing cycle times against micro-defect detection thresholds. Edge phase contrast enhances defect visibility, allowing shorter projection exposure times compared to traditional absorption tomography. Reduced exposure duration increases part throughput across multi-cavity manufacturing lines, lowering the metrology cost per array unit.
Scan duration remains the primary driver of unit inspection cost.
High-throughput automated batch scanning trades exposure time for projection frame counts. Decreasing exposure times increases Poisson photon noise, which obscures faint phase contrast fringes along thin cavity walls. Optimizing the inspection toll requires matching detector readout speeds, source power settings, and stage rotation velocity to maintain phase fringe signal-to-noise ratios without exceeding target batch cycle windows.

Cycle Time Allocation per Array Unit
Total scan duration scales with projection count, integration time per frame, detector readout overhead, and stage displacement velocity. Phase contrast imaging achieves equal wall boundary contrast at lower projection counts than absorption imaging due to edge enhancement effects. This optical amplification cuts volumetric dataset acquisition times, opening capacity on high-demand CT inspection lines.
Refractive wave interference fundamentally modifies raw attenuation measurements.
| Inspection Strategy | Projections per Scan | Integration Time / Frame (ms) | Total Batch Scan Time (min) | Inspection Cost / Unit ($) | Minimum Detectable Defect (μm) |
|---|---|---|---|---|---|
| High-Resolution Absorption CT | 3600 | 500 | 38.4 | 48.50 | 15.0 |
| Standard Edge Phase Contrast | 1200 | 150 | 5.8 | 7.30 | 8.0 |
| Fast Phase Contrast Array Scan | 720 | 80 | 2.4 | 3.05 | 12.0 |
| Ultra-Fast Continuous Rotation PCI | 450 | 40 | 0.9 | 1.15 | 22.0 |
Automated batch inspection systems achieve complete volumetric coverage only when detector readout rates match continuous stage rotation speeds.
Dossier Requirements for Certified Batch Gate Clearance
Quality documentation for flight-critical additive array batches compiles spatial resolution calibration records and phase algorithm parameters. The compliance dossier holds raw projection metadata, phase retrieval filter configurations, center-of-rotation log files, and gauge repeatability measurement reports. Storing complete phase reconstruction histories ensures full dimensional auditability across aerospace and medical device production batches.
Automated quality gates evaluate reconstructed phase volumes using convolutional neural networks trained on edge-enhanced density profiles. The classification system flags internal channel blockages, thin wall sag, micro-porosity clusters, and residual un-sintered powder. Once the automated evaluation pipeline validates part dimensions against CAD tolerance envelopes, the inspection dossier signs off digitally, releasing the multi-cavity array batch for final machining and assembly operations.